With global stock markets getting hit pretty hard in reaction to Britain’s decision to exit the European Union (“Brexit”), it’s easy to panic over how much further stocks may fall.
However, in times like these, it’s crucial to rely on “no nonsense” technical analysis to maintain an objective view to determine just how far stocks may fall before buyers step back in.
Continue reading to see a calm, clear picture of the next major support levels of the S&P 500, NASDAQ Composite, and small-cap Russell 2000 indices, as well as some crucial advice on how to trade this post-Brexit market in the near-term.
High Volatility = Less Trend & More Risk
Before reviewing the key charts, we would first like you to understand how the recent increase in stock market volatility affects swing traders.
When volatility picks up, as it has over the past few weeks (especially last Friday), the price action becomes less reliable, thereby making it very difficult to set tight stops. In volatile markets, the odds of opening “gap downs” increase as well.
Generally speaking, since the short-term trend is no longer in place, the potential for gains on new trades will decrease. Accordingly, the odds of getting stopped out will increase, which means the odds of producing a solid gain will decrease. This is what we call a very low reward-to-risk environment. The potential for reward is very little versus the risk.
In a bullish market, volatility remains low, and price action is much more reliable. This allows swing traders to set tight protective stops.
As such, the odds of getting stopped out decrease, while the odds of producing an above average gain increase. This is known a positive reward-to-risk environment. In such environments, the potential reward far outweighs the risk.
Triggered by last Friday‘s post-Brexit price action, current stock market volatility is high.
The S&P 500, NASDAQ Composite, and Russell 2000 all closed last week with an ugly, wide red bar (or candlestick), which suggests these charts will need at least a week or two of indecisive, choppy price action before they can return to trend mode.
Therefore, momentum swing traders should be extremely selective and use caution with new trade entries (both long and short) until the market’s next trend becomes established.
React, Don’t Predict
On the charts of major indices below, we show you long-term monthly charts for overall “big picture” perspective, followed by shorter-term weekly charts for close up views of current price action.
We do not like to spend time trying to predict where the market will go; rather, we show these technical charts simply to give you an idea of where key support levels exist. In turn, these support levels may attract buyers if/when the main stock market indexes drop to those levels.
Nevertheless, don’t forget that anything can and does happen on Wall Street, which is why we never try to predict anything. Rather, our job as technical swing traders is merely to react to the price action in front of us.
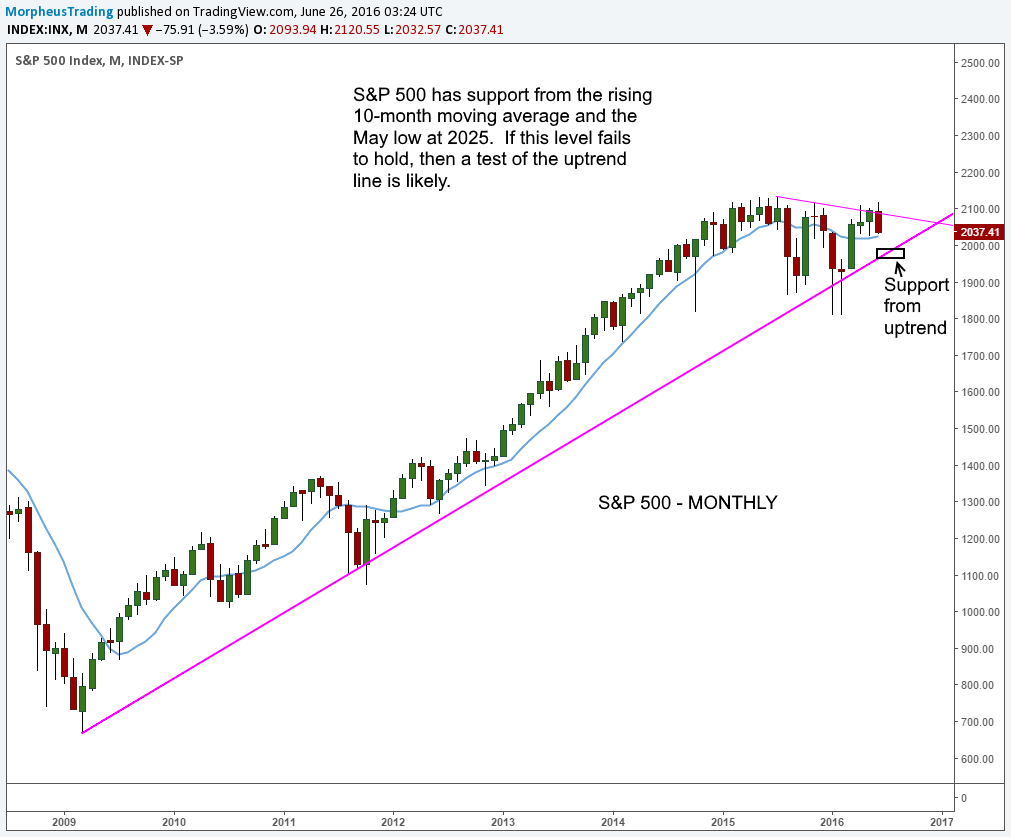
The monthly chart of the benchmark S&P 500 shows the index is still trading above its 10-month moving average, a key level of long-term support that is similar to the 200-day moving average on a daily chart.
This is positive because, depending on how the action plays out, the long-term uptrend line (purple line) may provide support on a test.
At the very least, we expect the S&P to form a “higher low” on the monthly chart. Take a look:
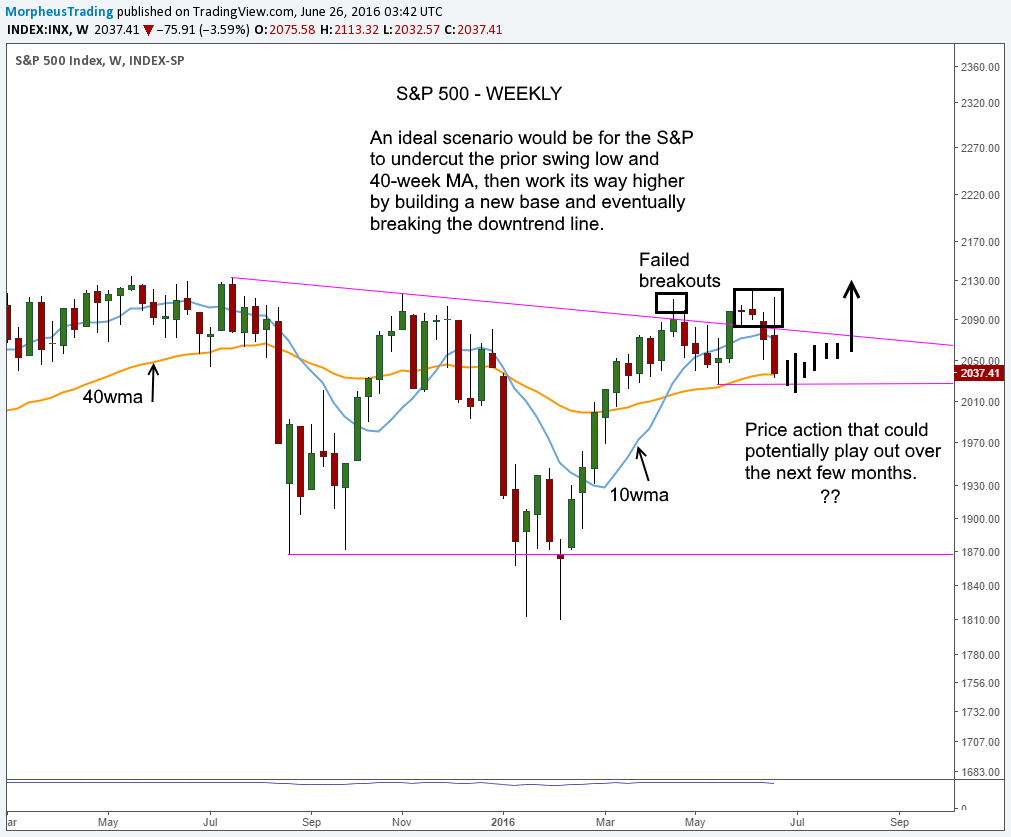
Drilling down to the weekly chart timeframe below, we get a better idea of how the market’s price action could play out over the next several weeks.
Look for the S&P to form another base of consolidation above its 40-week moving average (similar to 200-day moving average), with a few “undercuts” as ideal action:
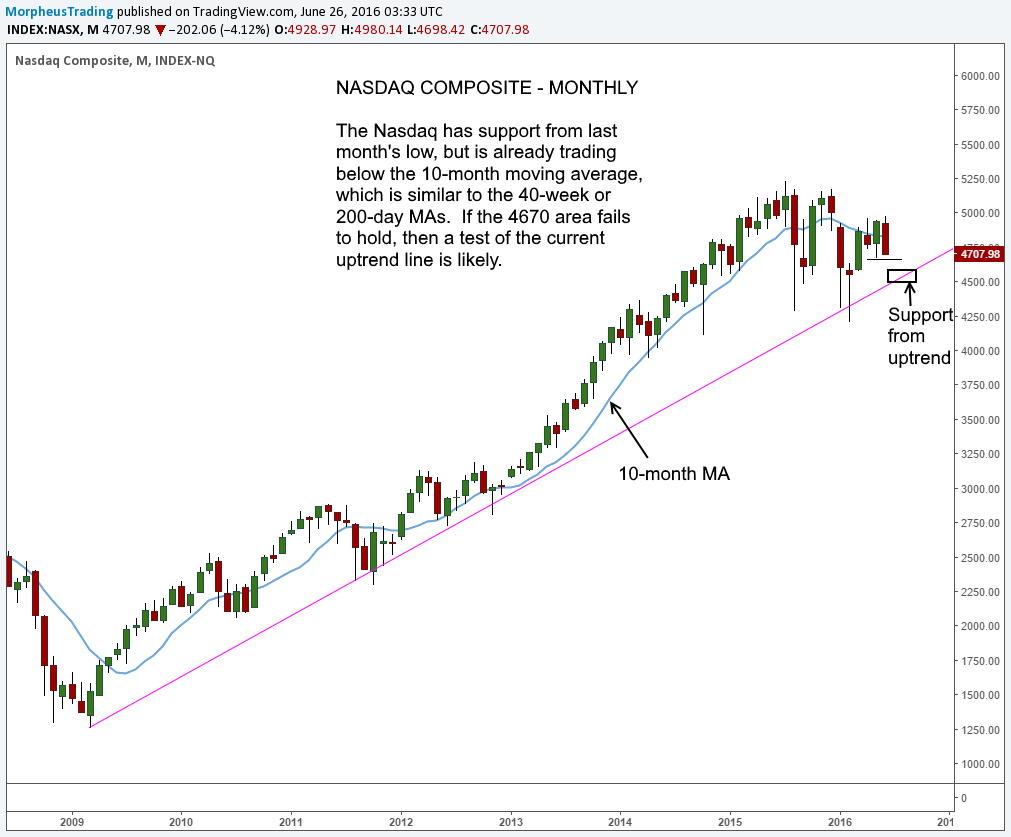
Unlike the S&P 500, the NASDAQ is already trading below its 10-month moving average, but the index is still trading above its long-term uptrend line:
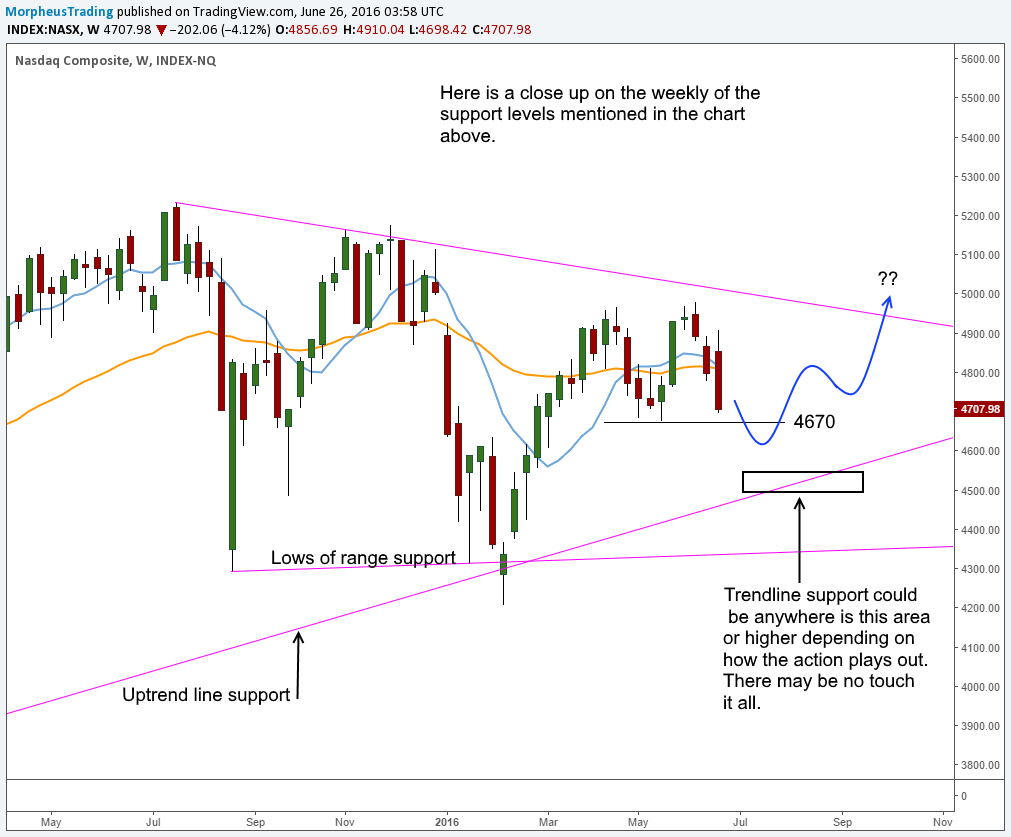
Next is the weekly chart of the NASDAQ, which shows the price action could play out in a similar manner to the S&P 500 in the coming weeks:
Russell 2000 Index
Although the blue chip Dow Jones Industrial Average is a more well-known index, the health of small caps is a better indicator of trend for the type of momentum growth stocks that we trade in our nightly swing trading newsletter.
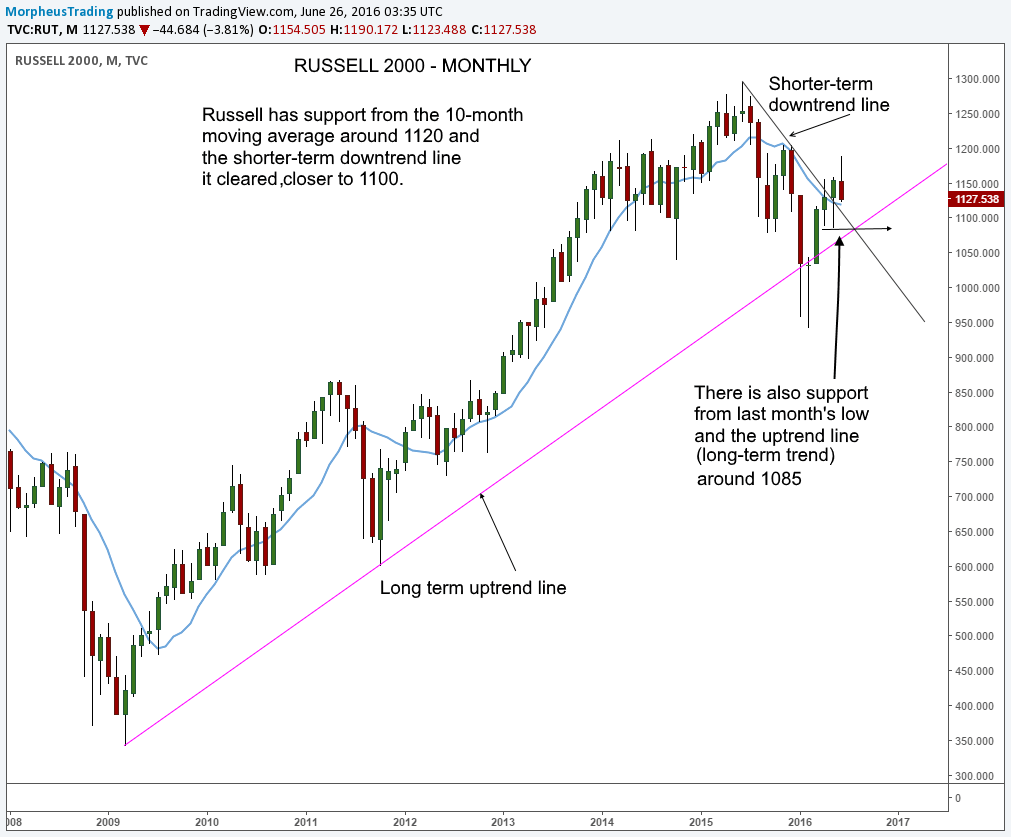
Since it exhibited relative weakness to the S&P 500 throughout much of 2015, the Russell 2000 is already trading much closer to pivotal support of its long-term uptrend line on the monthly chart.
However, with the small-cap index, there is also a shorter-term downtrend line that was cleared last month.
This prior level of resistance should now act as support on a pullback. to act as support on a pullback. We call this a “backside test of the downtrend line.”
Furthermore, even if the 10-month moving average does not hold as support, there is quite a bit of support just below the 1,100 level.
All these elements can be seen on the monthly chart below:
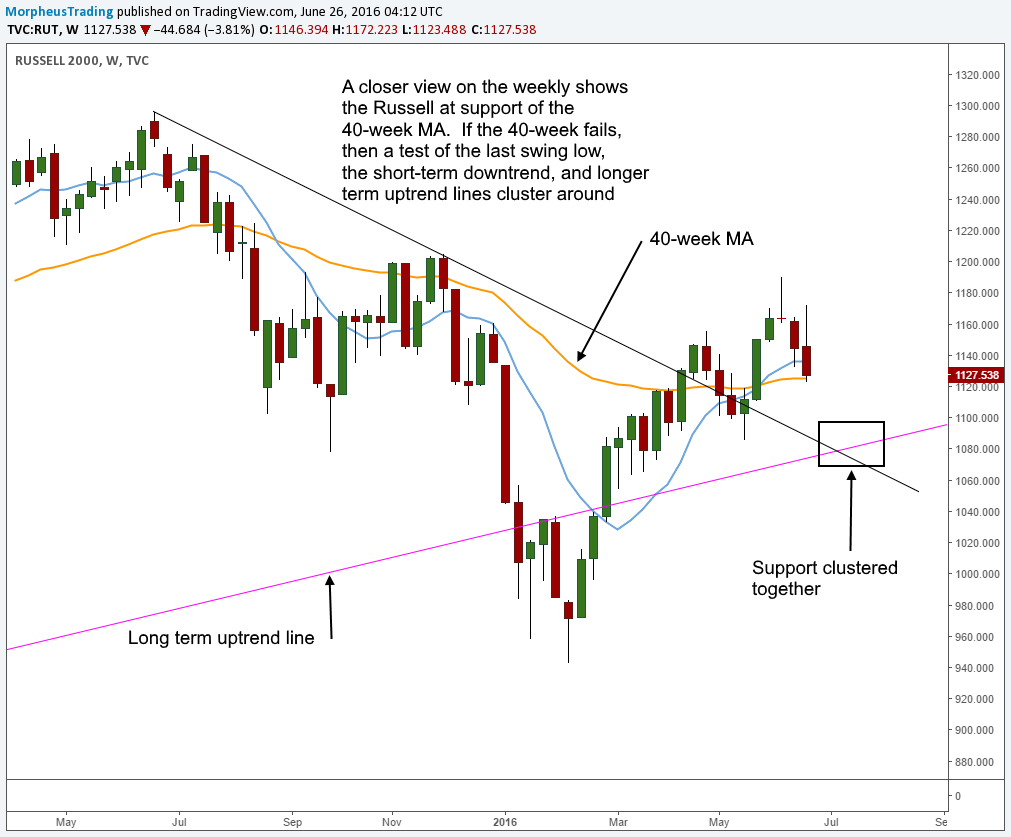
Finally, take a look at the weekly chart of the Russell, which details all the support levels located around 1,080 to 1,100:
Not The First, Nor The Last
With the major news outlets playing off the drama of Brexit and injecting panic into the hearts of investors, it’s easy to get suckered into believing the sky is falling.
But please remember this is not the first time (nor will it be the last) that surprising and unexpected geopolitical news created a short-term panic in the markets.
Yet, every time the knee-jerk panic selling fades way, excellent new opportunities for profitable swing trading are eventually once again created.
Talking Heads Suck (though the band is great)
As always, the key to consistent, long-term trading profitability is simply to plan your trades and trade your plan, without getting distracted by the financial “gurus” and talking heads of mass media (turning off the TV helps in this regard).
Above all, remember your job as a trader is not to predict where stocks will go. Instead, trade “in the now” by merely reacting to what you see in front of you every day.
Trading what you see, not what you think is the key to mental clarity, calmness, and consistent trading profits.
