Stocks shaking off whatever comes their way was the essence of my call - and with surprisingly strong non-farm payrolls, the fuse was lit. Rising relentlessly, the market broke out of the bearish wedge to the upside. Today, I'll examine the bull run that is underway, and present you with a view of quite a few important markets. The growing realization that all the post-corona money printing, stimulus bills, will be hugely inflationary provides us profit opportunities as in the early stages of inflation, many benefit and few pay. Let's welcome them the with open arms.
S&P 500 in the Medium- and Short-Run
I'll start with the weekly chart perspective (charts courtesy of http://stockcharts.com ):
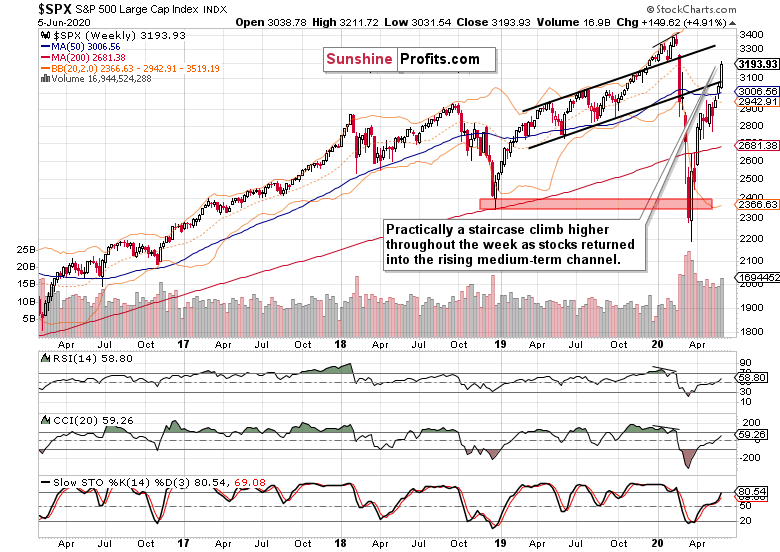
The bullish price action is impossible to miss. Respectful volume and a close near the weekly highs - what else can the stock bulls wish for? As prices reached the midpoint of the rising black channel, the weekly indicators still have room to grow before flashing amber.
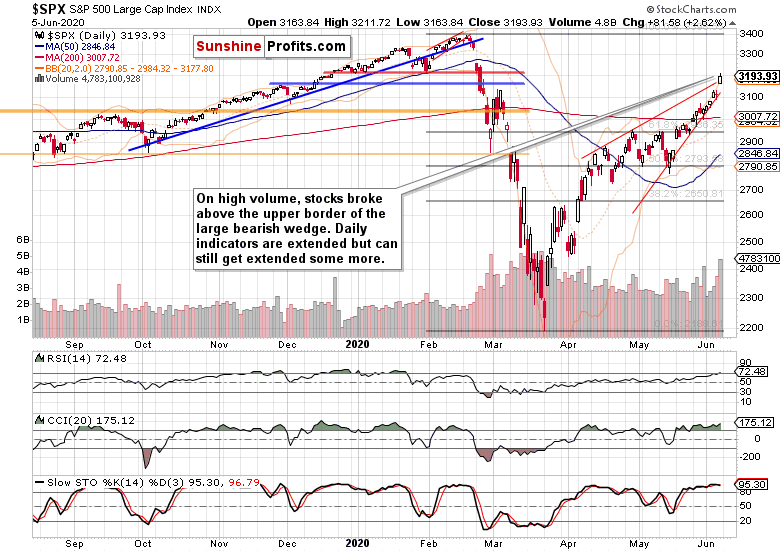
Friday's key development was the breakout above the upper border of the bearish wedge (thin red lines connecting April tops at its upper border, and May bottoms at its lower border). The move happened on the highest volume since the start of April, and on fundamentally positive news for the real economy. Is the party just getting started, or the fat lady is about to sing any moment now?
Let's recap the fundamentals. Friday's non-farm payrolls turning positive instead of merely decelerating, as was the case with manufacturing and others recently, is a strong kick in the teeth for bears, because it shows that the worst of the corona crisis is likely behind the us. I wouldn't count on bad data over the summer, as the US economy will go on filling the vacuum and repairing the damage sustained. Yes, it will take time, and stocks have been smelling that for quite a while - "less bad" will be the new good.
As the real economy goes on the mend, what has the power to derail it? A real flashpoint between the US and China, where the leaders don't back off, while denying each other the opportunity to save face. This doesn't seem likely to become a burning issue any time soon - the elections are far off, there's plenty of time still to play the China card.
The most likely candidate for turmoil generation is the next round of stimulus. The Fed will find it easier to expand its programs, but all the Treasuries to buy must come from somewhere. And if partisanship makes it difficult to pass the several-trillion bill the market is looking for, then we have a problem. A short-term one, but still.
How large, tailored and timely the fiscal stimulus would be, is a key risk factor for the coming weeks. Think the CARES Act extension et cetera - a misstep here, and we might be facing another unemployment surge (U3, U6 and I'm not even going into the participation rate) later in summer. Not throwing enough new money at the problems is precisely the risk Powell implicitly mentioned when the S&P 500 last declined to the 50% Fibonacci retracement.
So far though, the market is happy and getting more complacent. Some might even say salivating.
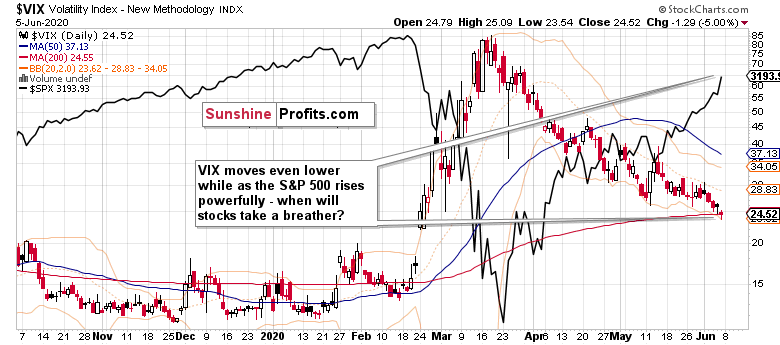
However, the key volatility measure, the VIX, is still above its late-February gap. It clearly has some more room to decline before even the bulls get uncomfortable. As for now, stocks are well-positioned to overcome whatever short-term bump in the VIX we see - and regardless of all the riots around, I think the setbacks wouldn't derail the bull. In other words, whatever choppy trading we get over summer (and we will get it), won't end the bull run.
The Credit Markets' Point of View
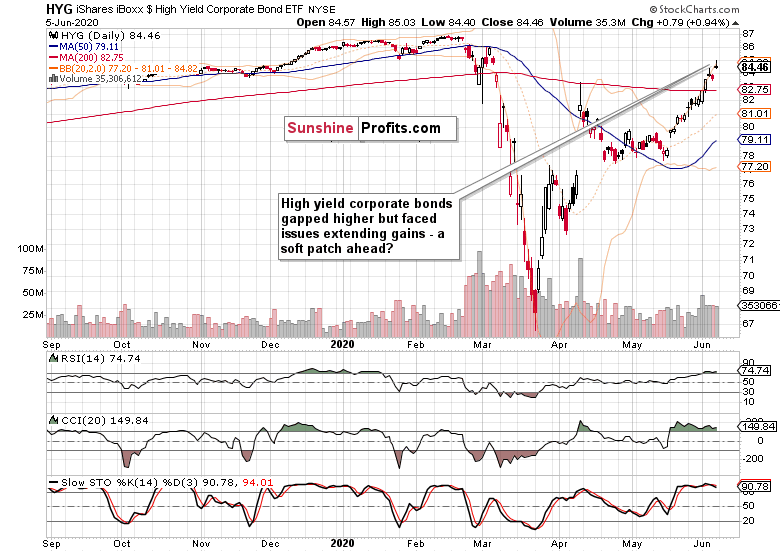
Despite renewed upswing, high yield corporate bonds (NYSE:HYG) aren't enjoying a totally smooth sailing. Wednesday's upper knot foretold Thursday's modest decline - and so could Friday's bearish candle. As the volume doesn't fit the reversal description, corporate bonds can take a breather, which would translate into a pullback for stocks. How worrying would that be?
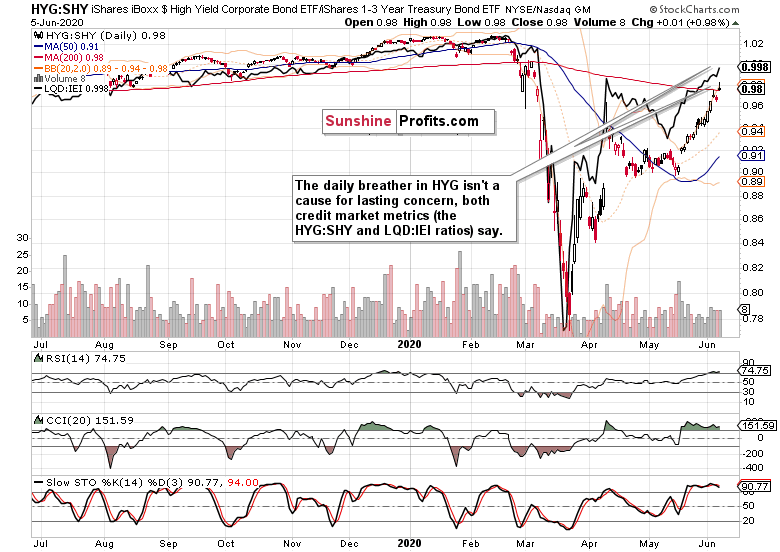
Friday's bearish HYG candle is mirrored in its ratio to shorter-dated Treasuries (NASDAQ:SHY). But neither this (HYG:SHY), or other credit market health metrics (investment grade corporate bonds to longer-dated Treasuries, LQD:IEI), seem willing to give up much of the latest sizable gains. Both look likely to recover fast, being primed for still more gains.
My key point regarding Treasuries on Friday was that they're telling us that another push higher in stocks is likely. It indeed happened - take a look how both shorter- and longer-term Treasuries did that day.
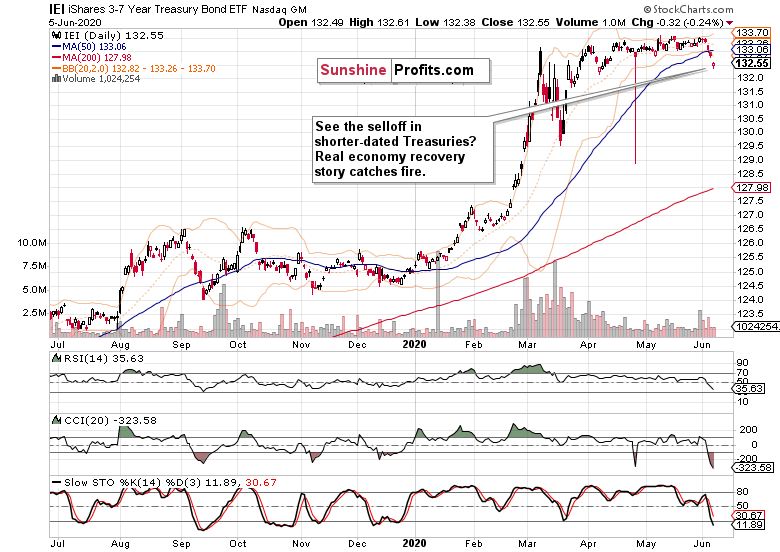
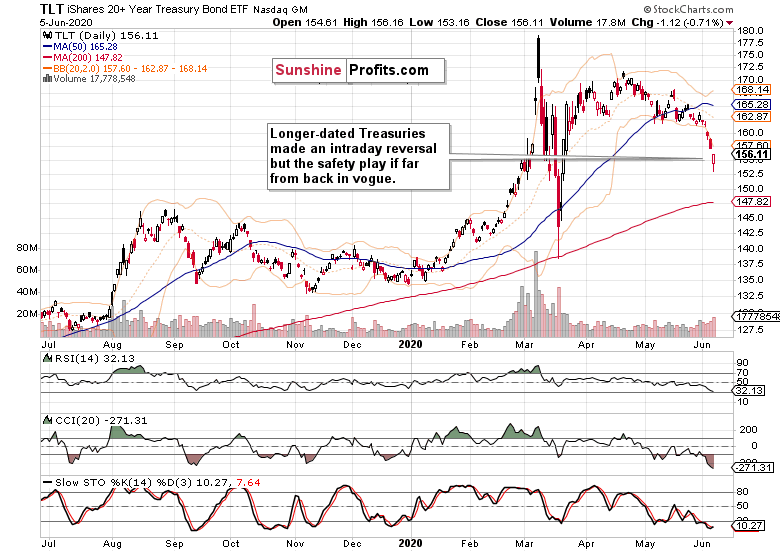
The short-term ones kept not too far from their intraday lows, while the longer-dated ones staged an intraday reversal. I wouldn't read too much into it being a sign of lasting stabilization though.
These were my Friday's remarks about the rising yields in Treasuries as they relate to corporate bonds:
(...) I think that this marks the rush into riskier assets, a rotation underway, with the Fed remaining as an ever larger buyer in the Treasuries market, relatively speaking. Treasury yields will thus remain lower than they would have been absent the interventions, and the fiscal deficits will remain serviceable. Unless the bond vigilantes show up one day.
That's what financial repression looks like - everyone is happy, and only the pension funds and people living off fixed income can't get returns that would keep up with inflation. Sure, the outlook for TIPS is better than for other Treasuries, but I guess it's clear.
And it's the prospect of inflation that is working its way through the system, that drives the stock bull run as well. That's why the stock bull market has much higher to run - just think about all the money sitting on the sidelines in bond funds waiting to be deployed, still looking for the other shoe to drop and none is arriving...
Another subtle sign of the run into equities is that corporate bonds aren't likewise crashing or leading to the downside. Conversely, even the safest investment grade ones are holding value much better than Treasuries. And I've already covered the stronger showings of high yield corporate bonds over their safer counterparts.
Let's check the implications of the USD moves.
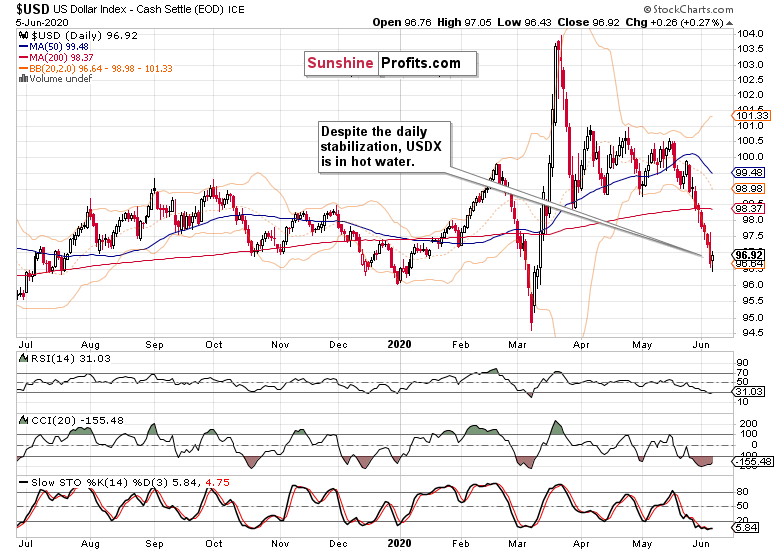
Given Friday's surprise, the bounce is disappointing. Sure, Thursday's declaration of the ECB's moves drove the common currency higher - and as the EUR/USD has the greatest weight in the USDX, it's noticeable.
But the key point is not any bigger or better ECB policy step. The greenback has been in a precarious position since the deflationary corona effects gave way to the stronger and stronger reflationary efforts. Reflecting that, I continue to think that the dollar will rather muddle through with a sideways-to-down bias over the coming months.
But this is not about the USDX as such, but about its influence on stocks. The key takeaway is that it won't be an obstacle to rising stocks regardless of the path it takes - down, sideways, or even a bit higher. This means that unless the dollar goes on the offensive, stocks won't come under significant selling pressure.
Inflation is coming, that's what the many asset classes are telling us.
Good for stocks for they don't love many things more than money printing.
Key S&P 500 Sectors in Focus
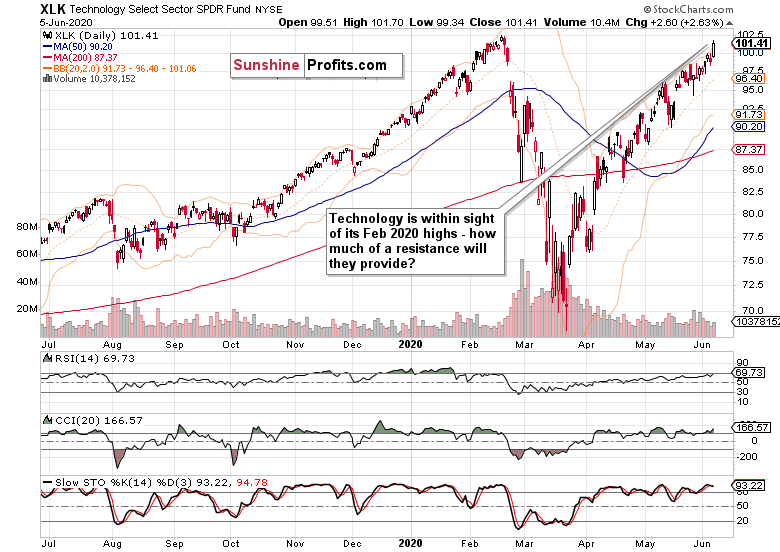
Technology (XLK) is taking on its February highs, and the only question appears to be how much of a resistance will these levels provide.
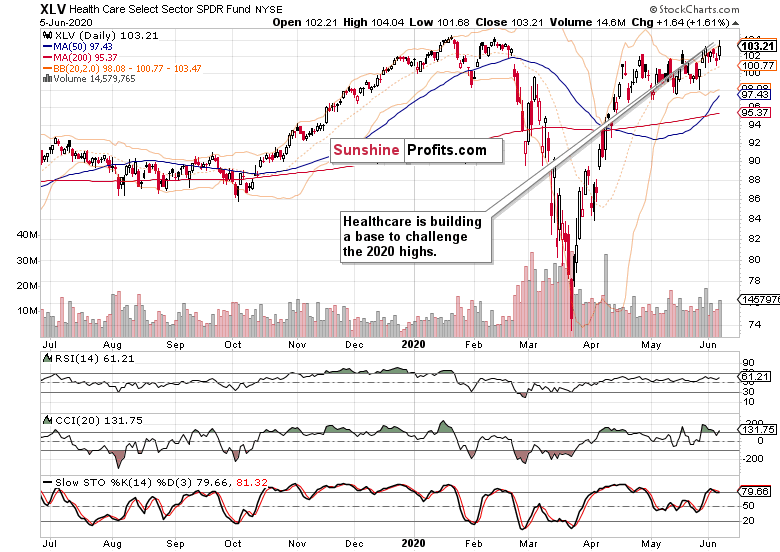
The pressure in healthcare (XLV) is building up, and I think a move higher is merely a question of time.
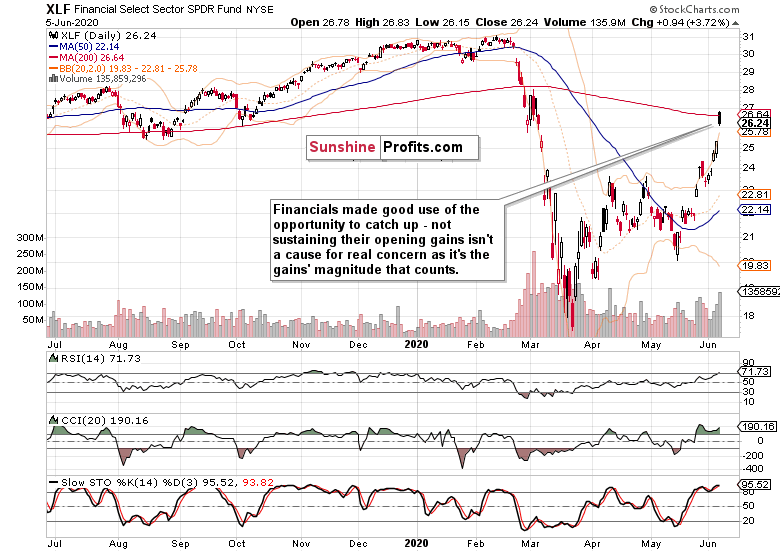
Despite Friday's retracement of almost half of the sizable bullish gap, financials (XLF) have more catching up to do, relatively speaking. As they work on the 200-day moving average, they'll overcome it regardless of the ominously looking latest daily candle on high volume.
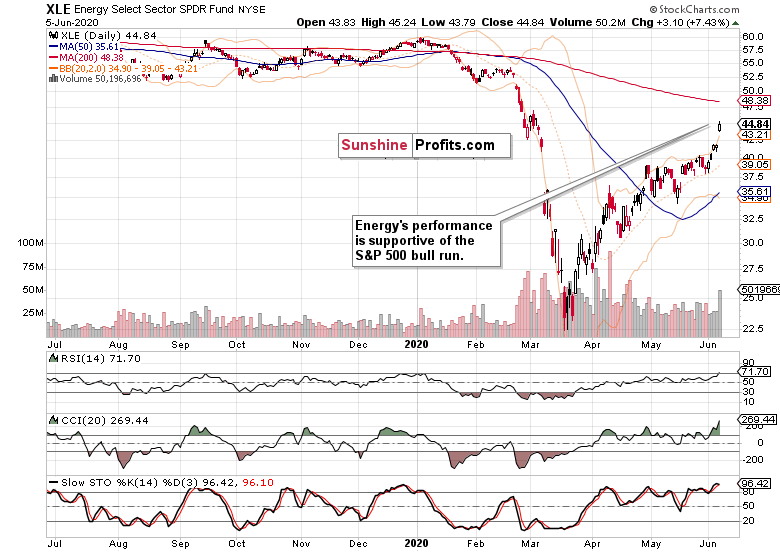
Energy (XLE) gapped higher, and extended gains. This is very bullish for the stock market advance.
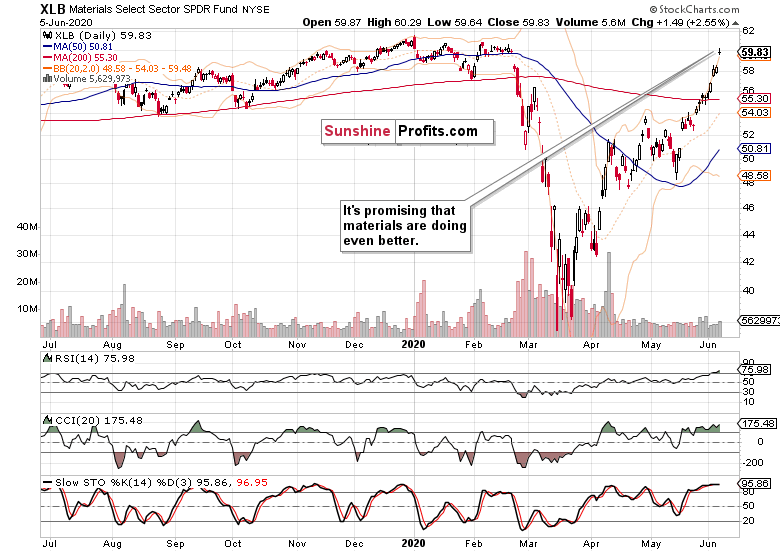
The action in materials (XLB) is looking even better for the bulls.
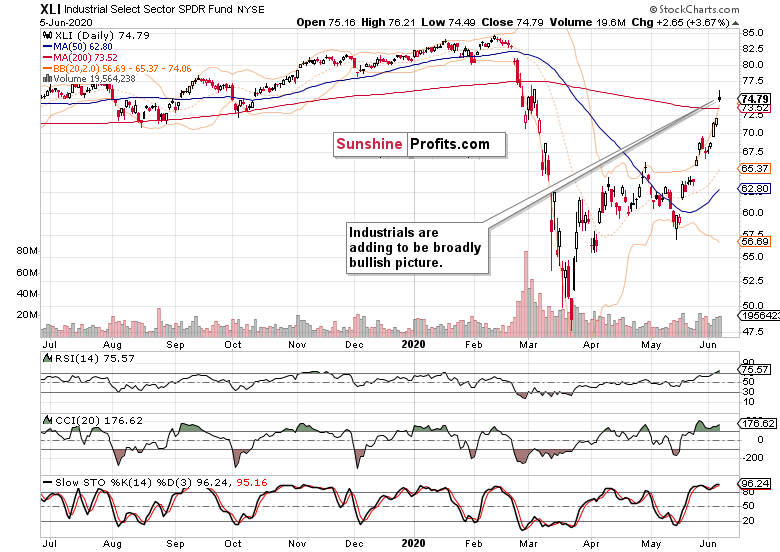
Despite the daily reversal, industrials (XLI) defended practically all of their opening gains.
Never mind that I said as little as about this stealth bull market trio (energy, materials, industrials) as I did. They're moving in symphony higher, no signs of making a top, which means that this market has much further to run.
Summing up
The bearish wedge in the S&P 500 was resolved with a sharp upswing. The weekly and daily charts highlight the bullish outlook, and credit markets including Treasuries support the rotation into stocks, and more buying power to come in from the sidelines. The sectoral performance remains conducive, and the strong showing of the early bull market trio (energy, materials and industrials) underscores that. Without the dollar under pressure and unlikely to stage more than a reflexive short-term bounce, stocks aren't likely to face a new deflationary headwind any time soon. But it's the performance of the debt market that is the cornerstone of my bullish outlook.
