Something big to move stocks is brewing under the surface - Treasuries are down, the dollar is under pressure, gold refusing to decline much... I think it's the market's growing realization that all the post-corona money printing, stimulus bills, will be hugely inflationary, and the participants are coming to grips with that realization. Will stocks provide a shelter?
S&P 500 in the Short-Run
Let's start with the daily chart perspective (charts courtesy of http://stockcharts.com ):
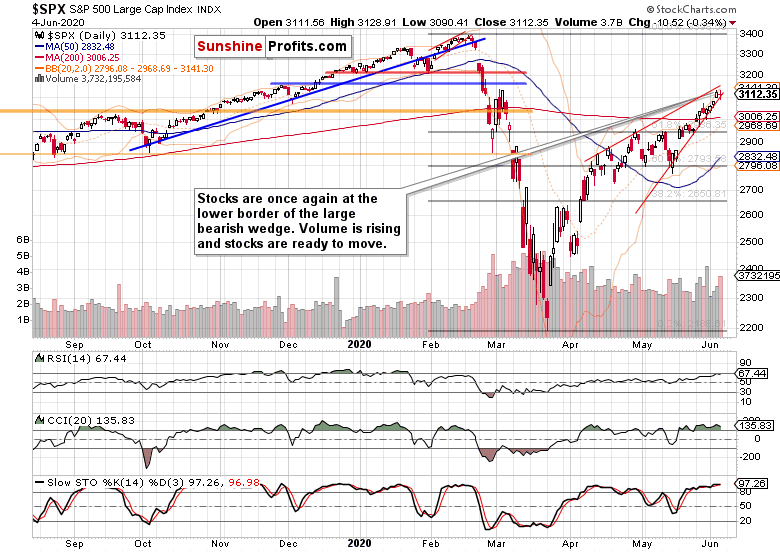
As the S&P 500 was again reaching for new highs, the action attracted more participants. The temperature is rising, and stocks didn't get anywhere Thursday. They're still trading inside the bearish wedge (thin red lines connecting April tops at its upper border, and May bottoms at is lower border) as it's nearing its completion.
I wouldn't write off Thursday's action as a daily consolidation. These were my Thursday's thoughts about the extended daily indicators, stock prospects and fundamental drivers:
(...) e.g. RSI is approaching the 70 level where it months ago used to muddle through before rolling over. For how long can they keep rising day in and day out - is the daily grind higher like clockwork sustainable? I don't think so, as every healthy uptrend needs to be puctured by the occasional sideways or down price action to make it sustainable - indirect Fed support present or not.
Please recall also the February bearish wedge - the predictable measured rise, and what came next. While I don't say that stocks are due such a watershed moment, for such a momentuous plunge with lasting capacity, I expect hesitation, sideways trading and an attempt to push prices lower in what I would describe as an opening stage in the summer doldrums. Yes, we're in a stock bull market but no tree grows to the sky (in one line, stocks especially).
What could drive that fundamentally? A growing realization that the riots are not a several-days' event? That the 9,300 arrests made so far haven't brought it under control? That the rioting goes on regardless of curfews and that more National Guard units are needed? Are the rioters practicing social distancing apart from widespread use of facial coverings? Can't that help bring about some form of the dreaded second coronavirus wave in around 8 weeks? Curfews or lockdowns, what good will that do to economic activity, reopening and small business wanting to just get back on their feet? And what about the potential to play the China card to divert attention from issues at home?
These are serious fundamental risks to the stock advance in the short- and medium-term. Sure, the Fed stands ready to act, and should things start getting out of hand, they will act - and as we've seen during the once-in-a-lifetime reaction to corona getting exponential (not even during the Spanish flu did the economy grind to such a screeching halt, fiat or not), the central bank would sooner of later overrride whatever deflationary forces might have had the upper hand in the short run.
Looking at yesterday's trading only, what events have actually had the power to bring the stock bull down temporarily? First, it was the Trump threat to block Chinese airlines` flights to the US, which also coincided with the intraday upswing in the USD Index. The second fly in the oitment were continuing jobless claims that instead of falling to just over 20,000K, rose to 21,487K. But stocks soon recovered from the shallow sub-3,100 dip.
Overall, it's just about China (remember the runup to Friday's Trump press conference?) and whatever happens with the Fed's printing press.
This is what I wrote as we approached Friday's non-farm payrolls:
(...) Yesterday's new unemployment claims moved below 2,000K - and the market viewed it as a success (the datapoint's downtrend continues). Sure, the June figures will likely keep getting better, just as May was better than April. Today's non-farm payrolls will likely take a cue from surprisingly strong Wednesday's non-farm employment change, and beat expectations.
That means the economy will be perceived as being on the mend, putting a floor below any temporary S&P 500 downswing we might see shortly - regardless of the daily chart's bearish wedge.
While the S&P 500 hasn't been trading with high volatility, the general air of calmness is deceiving, and a bigger move is about to unfold.
There are several omens that point in the prevailing direction of the upcoming stock move. Enter bonds.
The Credit Markets' Point of View
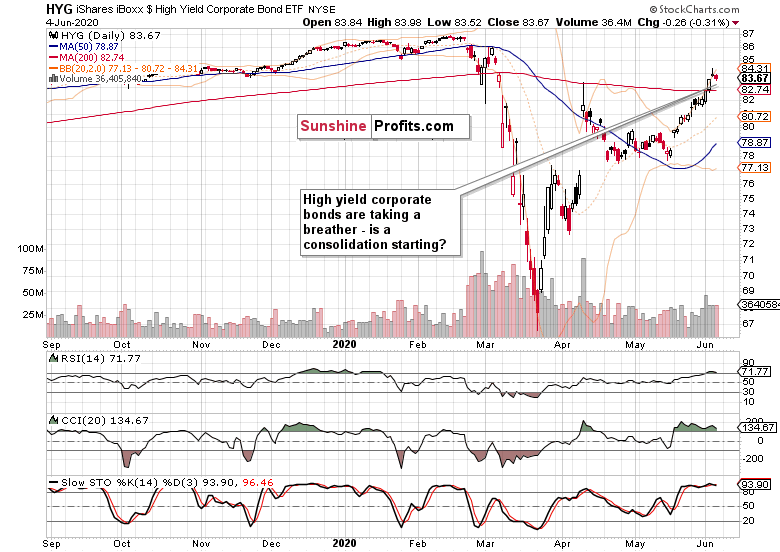
For the first time in quite a while, high yield corporate bonds (HYG ETF) closed lower, justifying my Thursday's call for a short-term consolidation as a minimum. It wasn't that hard to reach such a conclusion, because of Wednesday's daily reversal candlestick after the preceding prolonged runup.
While the price action is bullish, corporate bonds might attempt to break below Thursday's lows. The volume though says that this is a consolidation, not a reversal, which is why I think the HYG ETF will power higher.
Investment-grade corporate bonds (LQD ETF) confirm this opinion, because their decline happened on relatively lower volume. And as the ratio of high-yield corporate bonds to investment grade corporate bonds (HYG:LQD) stood still Thursday, these factors bode well not only for corporate bonds, but also for stocks.
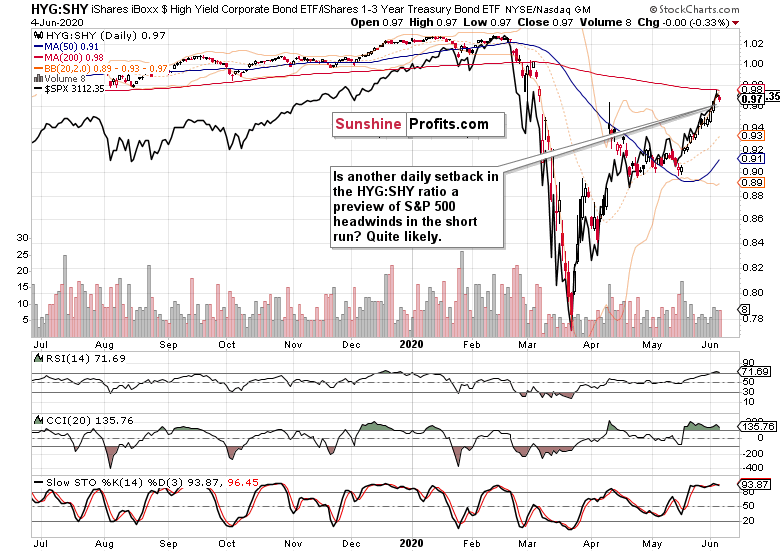
In line with the above observations, Thursday's downswing in high yield corporate bonds to short-term Treasuries appears as merely a blip on the daily screen that stocks largely ignored.
That doesn't mean though that stocks might not be getting too complacent. At least, that's what the favorite volatility measure, the VIX, says:
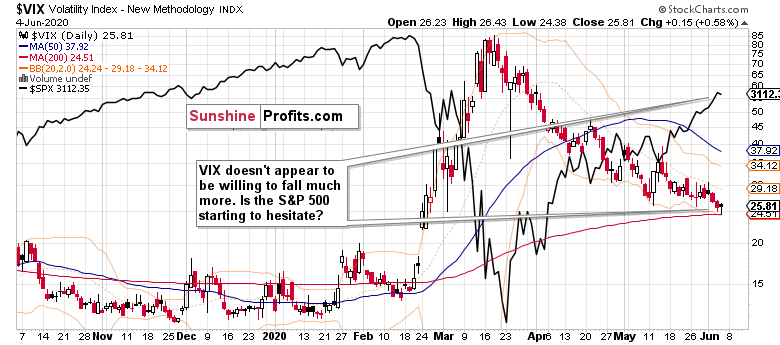
Refusing to move lower much further, stocks declined a little in response. If you look carefully at VIX, you'll see that it's been also trading in a wedge pattern - this time, in a bullish wedge. And as breaking below its lower border hasn't succeeded for two days in a row already, what does that mean? Rising volatility in all likelihood. And I think that the bears will be surprised by the prevailing directional move.
Are Treasuries trying to tell us that the rising volatility would come on the heels of another push higher in stocks? Looking at the two charts below, that's what I indeed see.
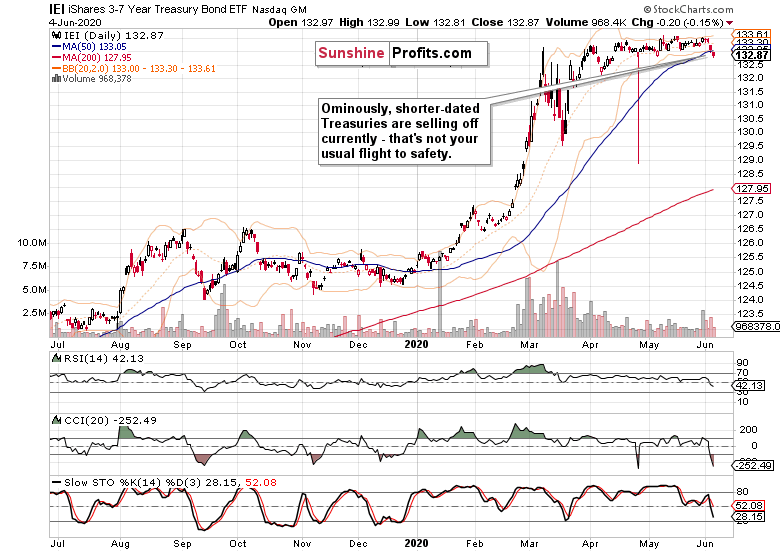
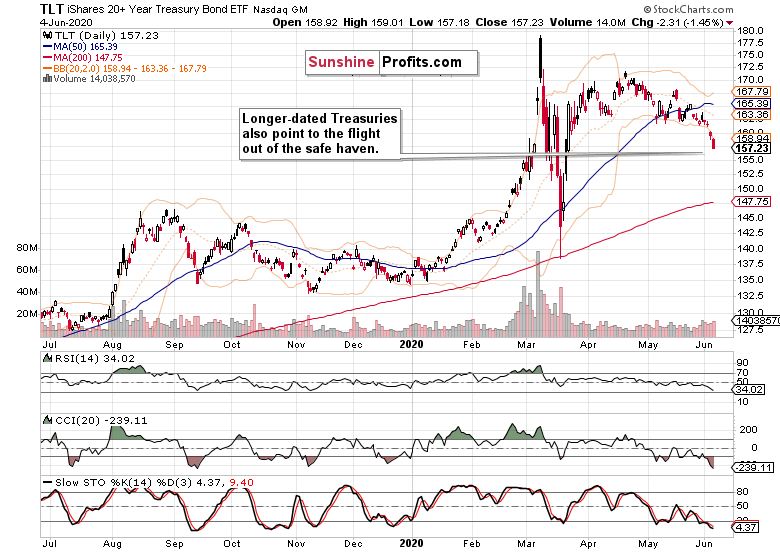
Treasuries are falling down across the board, which means that yields in the deepest of safe-haven markets, are rising. I think that this marks the rush into riskier assets, a rotation underway, with the Fed remaining as an ever larger buyer in the Treasuries market, relatively speaking. Treasury yields will thus remain lower than they would have been absent the interventions, and the fiscal deficits will remain serviceable. Unless the bond vigilantes show up one day.
That's what financial repression looks like - everyone is happy, and only the pension funds and people living off fixed income can't get returns that would keep up with inflation. Sure, the outlook for TIPS is better than for other Treasuries, but I guess it's clear.
And it's the prospect of inflation that is working its way through the system, that drives the stock bull run as well. That's why the stock bull market has much higher to run - just think about all the money sitting on the sidelines in bond funds waiting to be deployed, still looking for the other shoe to drop and none is arriving...
Another subtle sign of the run into equities is that corporate bonds aren't likewise crashing or leading to the downside. Conversely, even the safest investment grade ones are holding value much better than Treasuries. And I've already covered the stronger showings of high yield corporate bonds over their safer counterparts.
But there is more.
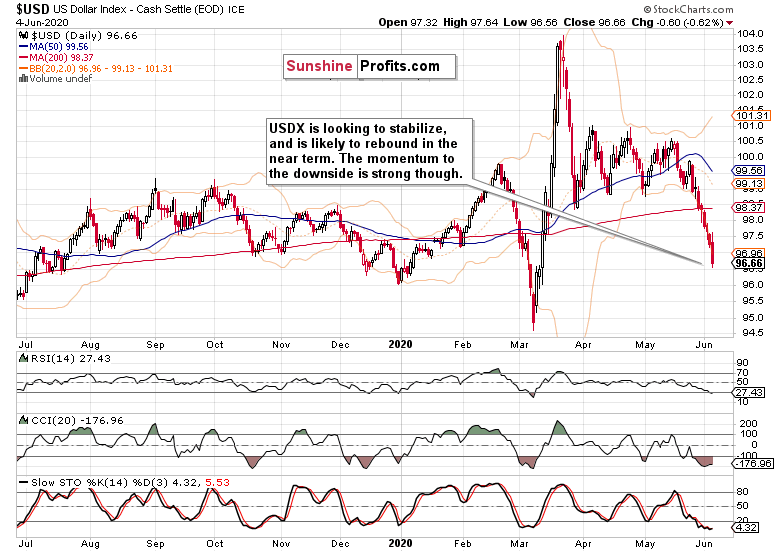
The USD Index is rolling over as I called for it to do later this year, and I think we're witnessing the opening stage. While the daily indicators are conducive to a rebound, and so is the vicinity of a major rising support line (the 200-week moving average on the USDX weekly chart, currently at 96.27), I think the greenback will rather muddle through with a sideways-to-down bias over the coming months.
But this is not about the USDX as such, but about its influence on stocks. The key takeaway here is that it won't be an obstacle to rising stocks regardless of whether it goes down, sideways, or a bit higher over the coming months.
Given the strongly positive jobs data arriving (2,509K non-farm payrolls with unemployment rate decreasing to 13.3%), the dollar could have staged a rebound. The fact that it doesn't, is telling, and supports my thesis of the dollar not really rising (there aren't such deflationary pressures anymore) but rather rolling over and going sideways-to-down. This short-term dynamic means that unless the greenback makes really bullish moves, stocks won't come under significant selling pressure.
Inflation is coming, that's what the many asset classes are telling us. These were my parting thoughts Thursday:
(...) Given the Fed's and fiscal measures taken (they're joined at the hip, because where would all the new Treasuries to buy come from if not from deficits?), the odds favor the Fed to keep at winning this reflationary game right now.
Good for stocks for they don't love many things more than money printing.
Summary
Summing up, Thursday's hesitation in stocks went hand-in-hand with a decline in corporate bonds. The bearish wedge meant that the S&P 500 was vulnerable in the short-term to a temporary takedown, regardless of the strong showing of the early bull market trio (energy, materials and industrials). We didn't get much in terms of a temporary pullback in the index, again confirming that we're indeed in a bull market, where money is to be made rather on the long side. While the intraday sectoral dynamics favors much more upside to come, it's the debt markets' performance that is the cornerstone of my bullish outlook.
