I. Market Efficiency: Active vs. Passive
Is the market efficient? In other words, can one outperform the market? Most people would argue the market is semi-efficient as best; yet it is still difficult to outperform the market in the long term. After all, out of thousands of hedge funds that claim they have superior investing skills, only a handful have delivered alpha consistently in this $3T industry. So why pay such high fees for no better returns than can be achieved by indexing? For this very reason, passive investing has benefited enormously in 2016. According to Morningstar, active equity funds had $340B in outflows in 2016, while passive equity funds generated $505B of inflows (source: corporate.morningstar.com/US/documents/AssetFlows/AssetFlowsJan2017.pdf). However, this doesn’t necessarily mean passive investing produces fantastic returns: Even with the Trump rally since the election, the S&P 500’s total return in 2016 was 11.96%; the year before that it was 1.38%. But don’t forget the volatility in the stock market: The S&P 500 had point swings of over 400 points and the Dow point swings of over 4,000 points in 2016. That level of volatility translates into a tremendous amount of risk for mediocre returns.
II. Outperform the Market
Although passive investing is growing fast, alpha is still being captured by some active managers. In addition, the academic literature has identified a number of strategies that outperform the market in the long run, such as momentum investing, P/E (price to earnings) investing, etc. After all, imperfect information sharing favors those who do their research. Today we will share one strategy that would have outperformed the market by 10,373% in the past half century.
Bond yields have risen sharply since November, while gold has made a comeback of over $100 since December. CNBC recently cited a report from Bank of America Merrill Lynch (NYSE:BAC), stating that both the stock market crash of 1973–1974 and Black Monday in October 1987 were preceded by three quarters of rising bond yields and rising gold (source: cnbc.com/2017/02/06/look-out-gold-and-bonds-are-sending-a-signal-reminiscent-of-1987-and-1973-market-crashes.html). The reason for the crashes, they argue, is that rises in interest rates and gold lead the Fed to raise rates to fight inflation – and rate hikes are bad news for stocks. However, focusing on two events in nearly 50 years may appear to the sharp-sighted to be cherry-picking.
We take the research further and find that when both bonds and gold rise in a one-year period, the following one-year performance of the stock market is much lower than the historical average. However, if bond yields rise and gold drops, the market performs stunningly well in the following year. Not only is the absolute return twice the average, but also the probability of a positive return is very high – almost 90%! Moreover, The t-test between the two scenarios is significant at the 1% level. The reasons for the out-performance may be the following: The bond sell-off means a strong rotation from bonds to stocks; meanwhile, the gold price drop lifts inflation concerns, which means no Fed rate hike. Interestingly, the stock market also did relatively well when gold went up and bonds went down. This effect could also be attributed to the unlikelihood of Fed rate hikes.

Table 1. Summary statistics of stock market returns since 1970.
III. Strategy
We start by forming a portfolio that buys the S&P 500 at the beginning of each year if the market falls into either of these categories: gold down and yields up, or gold up and yields down in the past year. We do not want to short the market if both gold and yields were up, because the market isn’t necessarily going to fall in that scenario—it’s just, on average, flat. Don’t forget that there are three ways to invest: long, short, and cash. Hence, our portfolio will hold cash if yields and bonds went up in the past year. Lastly, given that the probability of positive returns is extremely high after gold drops and bonds rise, we should consider using leverage to maximize our returns. Contrary to intuition, employing leverage does not necessarily introduce more risk if conviction is high. Therefore, our portfolio will use 3X leverage in the most bullish case. Leverage can be achieved fairly easily nowadays through ETFs. For the sake of simplicity, let’s assume we would have been able to use leverage at a reasonable cost during the entire sample period.
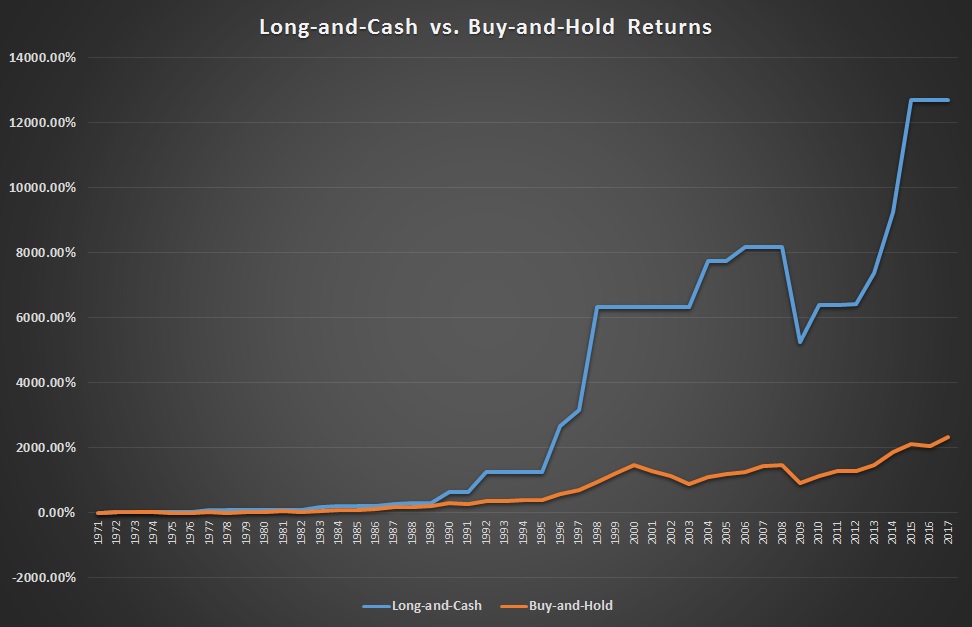
As we can see in the comparison below, buying and holding the S&P 500 would have generated 2,328% returns since 1970, whereas our long-and-cash strategy would have produced 12,700%* returns, assuming 1% annual fees. That’s 10,372% out-performance, or 19.55% annual excess returns. To confirm that risk is not increased by adding leverage, we note that the risk-adjusted return Sharpe ratio of our strategy is 0.43, while the buy-and-hold strategy’s Sharpe ratio is 0.42. More importantly, our strategy would have resulted in only three negative annual returns (before fees), one-third the number in the S&P 500’s negative return history. Last but not least, by holding cash we would have avoided some negative years – earning no money is still better than losing.

Figure 1. Long-and-cash vs. buy-and-hold returns
IV. Conclusion
Since the market is not perfectly efficient, active investing should be able to provide superior returns. But by no means does this suggest investors ought to just park their cash with hedge funds. If they choose wisely, investors will find true alphas. **
*Because leveraged products may not provide dividends, our calculation ignores dividends.
**Our Leveraged Volatility ETF portfolio employs a similar quantitative strategy. To protect our proprietary research, we utilize a simplified model in this commentary. For more details about our newly launched strategy, please send us an email. We will be happy to discuss the strategy and provide specific information.
