After a slow burn to record highs in 2017, the U.S. stock market has been on a roller coaster this year, with volatility ramping up in a big way. As such, the Cboe Volatility Index (VIX) -- also known as Wall Street's "fear gauge" -- kicked off 2018 with a bang, logging its best start to a year ever. Against this backdrop, near-term put open interest on a handful of major equity exchange-traded funds (ETFs) has surged, sending up a stock signal not seen since before the November 2016 presidential election.
Near-the-Money April Puts Prevalent
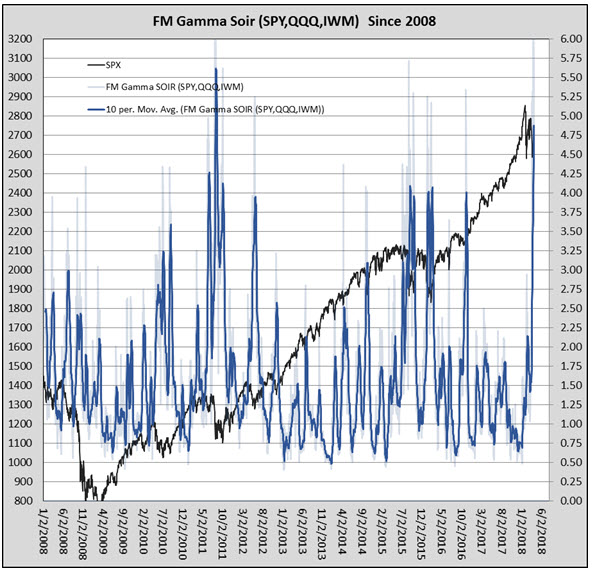
Specifically, the combined front-month gamma-weighted Schaeffer's put/call open interest ratio (FM-GW SOIR) on the SPDR S&P 500 (NYSE:SPY), PowerShares QQQ Trust Series 1 (NASDAQ:QQQ), and iShares Russell 2000 ETF (NYSE:IWM) surged above 6.0 last week -- the most elevated reading since 2011, according to Schaeffer's Quantitative Analyst Chris Prybal. In a nutshell, this indicates that near-the-money put open interest on SPY, QQQ, and IWM handily outweighs call open interest in the April series of options, which expires at next Friday's close.

Previous Option Signals Have Been Bullish
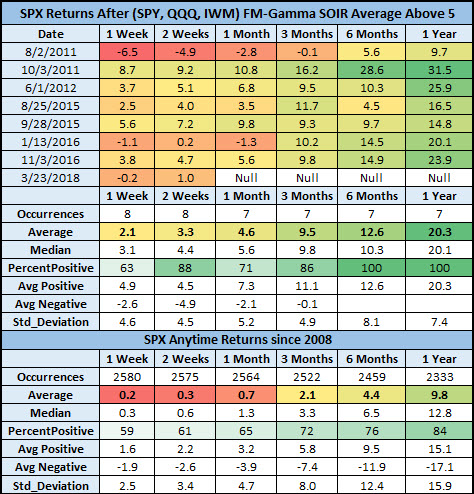
The combined FM-GW SOIR 10-day moving average officially topped 5.0 on March 23, marking its first trip above this threshold since Nov. 3, 2016. Below is how the S&P 500 Index (SPX) has performed after previous such highs in this metric, looking back to 2008. Notice that there were no signals in 2013, 2014, or 2017.

One week after a signal, the SPX has gone on to average a return of 2.1% -- about 10 times its average anytime one-week return of 0.2%, looking at data since 2008. Two weeks out, the S&P was up 3.3% -- again, roughly 10 times the norm -- with a positive rate of 88%. It's a similar story looking all the way out to a year after a signal, with the SPX averaging a gain of 20.3% -- more than twice its average anytime return of 9.8%. Plus, the index was higher 100% of the time both six and 12 months after these options signals.
'Fear Index' Tends to Drop After Signals
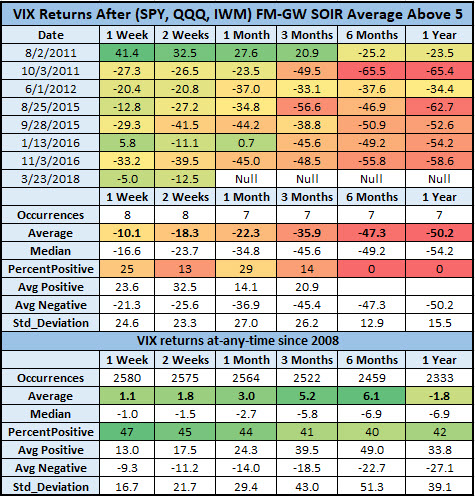
As you might expect, the VIX has plummeted after the combined SPY/QQQ/IWM FM-GW SOIR average tops 5.0. The "fear index" suffered an average loss at every checkpoint up to a year later, compared to average anytime gains. Only at the one-year marker has the VIX averaged an anytime loss of 1.8% -- though its post-signal loss of 50.2%, on average, far overshadows that. In fact, the VIX was higher 0% of the time six and 12 months out, compared to 40% and 42% win rates, respectively, anytime since 2008.

In conclusion, there's an abundance of near-the-money put open interest on the SPY, QQQ, and IWM -- more than we've seen in over a year. As Schaeffer's Senior V.P. of Research Todd Salamone noted on Monday, heavy SPY put open interest could translate into an options-related floor for stocks in the near term. What's more, after previous instances when the combined front-month gamma-weighted SOIR of the aforementioned ETFs went north of 5.0, the stock market tended to rocket higher, while the VIX plummeted.
