The Cboe Volatility Index (VIX) -- also known as Wall Street's "fear gauge" -- has been much more active than usual to start 2018. The index last week jumped more than 50% for the third week this year -- already the most surges of that magnitude in one year ever for the VIX. As such, the index has racked up its biggest year-to-date gain ever for this point in the year, according to Schaeffer's Quantitative Analyst Chris Prybal -- which could have bullish implications for the S&P 500 Index (SPX), if history repeats.
1Q Surge is a Change of Pace for VIX
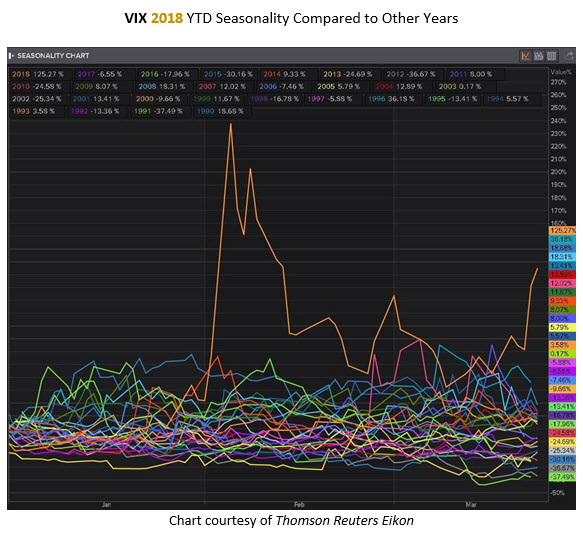
Below is a chart of VIX year-to-date performances through March 23. As you can see, the VIX's 2018 gain of more than 125% through Friday's close is the biggest on record. However, as Prybal noted, it's much easier for the VIX to skyrocket when it starts the year in the low double digits, as it did this year.
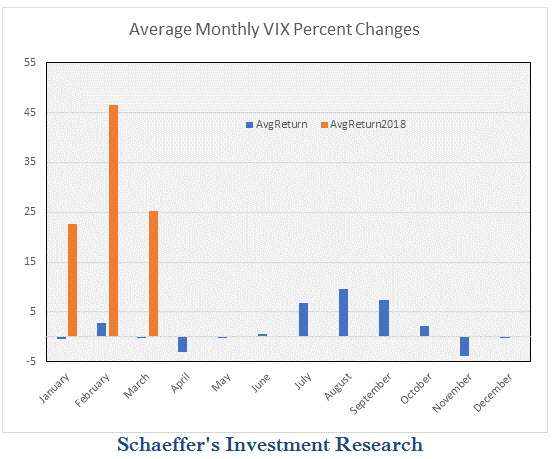
This early rally in the fear barometer -- not to mention its volatility ETN relatives -- defies the typical seasonal trend. As of Friday, the VIX was up more than 20% in March -- the third straight month of gains of at least that much. That's dramatically higher than the index's average monthly returns, with the VIX typically in the red both in January and March. Further, VIX pops tend to occur in the late summer months, when stock traders "sell in May and go away."
'Fear Gauge' Tends to Cool Off After Big Weeks
As alluded to earlier, the VIX last week surged 57.4% -- its third weekly gain of more than 50% in 2018, already marking a record. The index surged sharply in early February, due to a tech-led stock market correction. Only two other years -- 2010 and 2015 -- saw more than one weekly VIX gain of 50% or more.
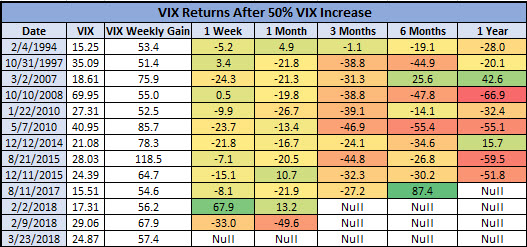
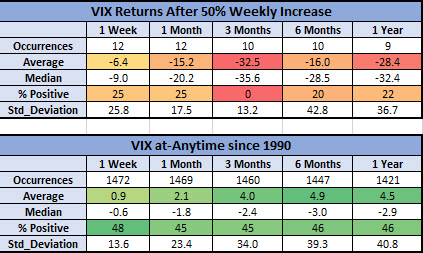
Following these huge weekly rallies, however, the VIX tends to cool off dramatically. The index was down 6.4%, on average, one week later, and higher just 25% of the time. One month out, the VIX was down 15.2%, on average, compared to an average anytime one-month gain of 2.1%, looking at data since 1990. Three months later, the "fear gauge" was down 32.5%, on average, and lower every single time. That's compared to an average anytime three-month gain of 4%, with a 45% positive rate.
That trend continues at the six-month and one-year markers. The VIX was lower by 16% and 28.4%, on average, respectively, after steep weekly gains, and higher no more than 22% of the time. That's compared to an anytime win rate of 46% for both periods, with average gains of 4.9% and 4.5%, respectively.
Stocks Tend to Rally After VIX Pops
So, what does that mean for the stock market? Well, it could be a bullish signal, if past is prologue.
One week after VIX weekly surges of 50% or more, the S&P 500 was up 0.9%, on average, and higher two-thirds of the time. That's compared to an average anytime one-week gain of just 0.2%, with a 56% win rate. Three months later, the SPX was up 4%, on average -- nearly double its average anytime gain of 2.2%, since 1990. Further, the stock market index was in the black 80% of the time. One year out, the SPX was up a bigger-than-usual 11%, and sported a healthier-than-usual win rate of 89%.
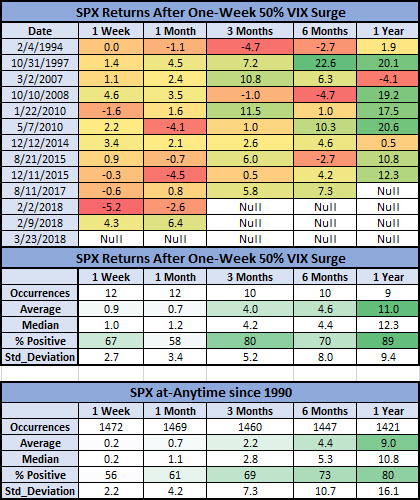
In conclusion, the S&P has already bounced back in a big way after last week's VIX pop, enjoying its best day in years on Monday. If history is any indicator, the index could continue to outperform over the next year. In the meantime, traders should continue to monitor the SPX's dance around two very important moving averages, per Schaeffer's Senior V.P. of Research Todd Salamone.
