
“Follow the trend lines, not the headlines.”
The quote, attributed to former President Bill Clinton, is one of my favorite pieces of advice. Clinton was referring to long-term data that show that conditions have actually been improving for the human race despite popular opinion to the contrary. When applied to investing, it cautions against missing opportunities because you’re too busy reacting to negative news.
To be sure, there’s more than enough negative news right now: international trade tensions, volatility in Syria, Brexit, an impeachment inquiry and much more. If we based everything on what the talking heads tell us, we may never have the confidence to invest so much as a dime.
Instead, it is important focus on fundamentals such as moving averages and standard deviation. We follow leading indicators such as the purchasing manager’s index (PMI) and consumer confidence index. These factors are many times more effective than the headline news at shining a light on the right path.
Did You Catch These Opportunities?
Here’s an example. A lot of the news coming out of China right now is negative. Its economy is slowing. Tariffs are hurting trade. The Hong Kong protests are causing geopolitical pressure. It’s enough to make an investor run and hide.
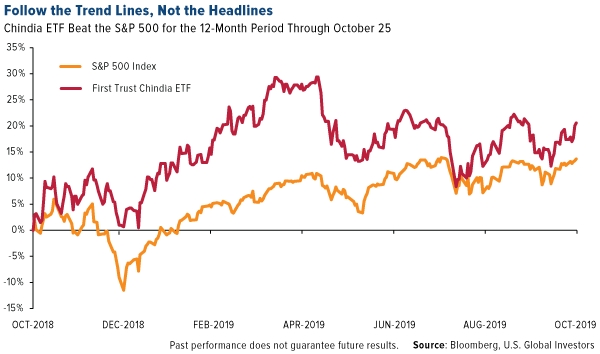
Which would be a mistake. Take a look at the chart below. The First Trust Chindia ETF, which invests in companies in both China and India, is up more than 20 percent for the 12-month period through October 25. That’s enough to beat the S&P 500 over the same period.
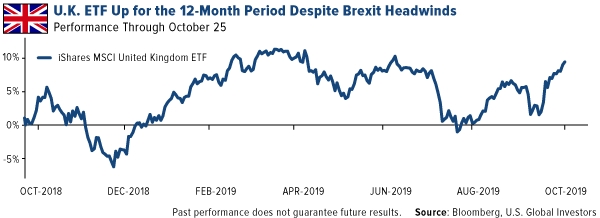
Or consider British stocks. You might think that Brexit uncertainty has made investing in the U.K. a nightmare. And yet the opposite seems to be the case—the iShares MSCI United Kingdom (NYSE:EWU) ETF is up close to 10 percent for the 12-month period.
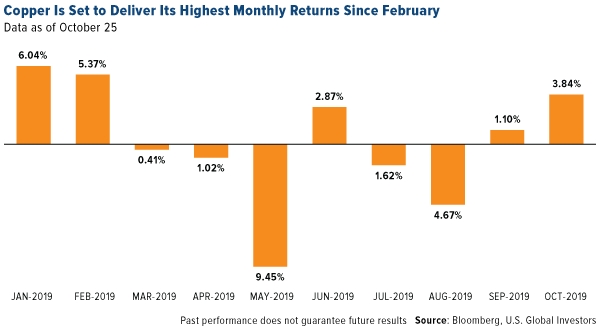
Another good example are the recent copper strikes in Chile. In this case, bad news is actually good news. With production halted for days at Chuquicamata, the world’s largest open pit copper mine by volume, global supply could be disrupted, which may push up prices. Due in part to the strikes, copper is on track for its second straight month of positive gains and its best month since February.
Keeping an Eye on the PMI
Again, one of our favorite leading indicators is the manufacturing purchasing manager’s index, or PMI. The gauge compiles data from thousands of factories and manufacturers across the globe, measuring data points such as output, new orders and employment. At the beginning of every month, we get a number that reflects the health of the industry.
The higher the number is above 50.0, the faster factories are expanding their business. The lower the number is under 50.0, the faster they’re shrinking.
September’s PMI was 49.7. That’s in contractionary mode, but because it’s up slightly from August’s 49.5, factories are pulling back at a slower rate.
We won’t know what the PMI is for October until later this week, but if it shows that we’re back to a neutral 50.0 (or better), it could mean good things going forward for energy and commodities.
According to our own research going back 10 years, when the global manufacturing PMI rose above its three-month moving average, commodities and commodity stocks appreciated six months later. Copper, for instance, gained an average of around 10 percent, with a 71 percent probability of occurrence. West Texas Intermediate (WTI) oil returned about 5 percent. And so on.
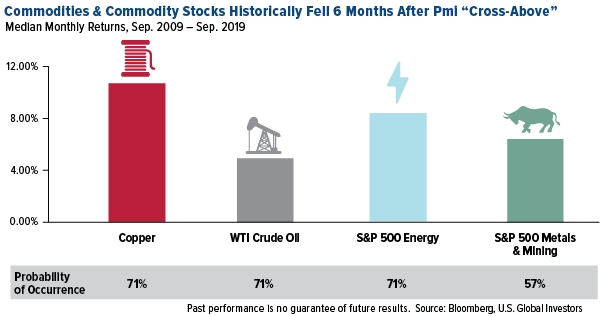
Conversely, when the PMI fell below its three-month moving average, materials historically declined—or, in the case of energy, was essentially flat—six months later.
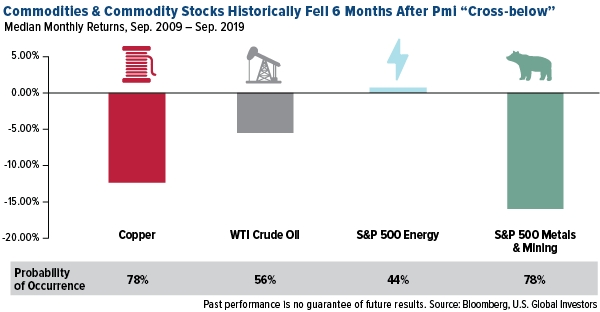
Again, these results are based on 10 years’ worth of data. We’re hoping for a stronger PMI for the month of October, which would help give commodity prices and mining stocks an extra shot of momentum going forward.
The Purchasing Manager’s Index is an indicator of the economic health of the manufacturing sector. The PMI index is based on five major indicators: new orders, inventory levels, production, supplier deliveries and the employment environment. The Consumer Confidence Index (CCI) is an indicator which measures consumer confidence in the Economy.
The S&P 500 Stock Index is a widely recognized capitalization-weighted index of 500 common stock prices in U.S. companies. The S&P 500 Energy comprises those companies included in the S&P 500 that are classified as members of the GICS energy sector. The S&P Metals & Mining Select Industry Index represents the metals and mining sub-industry portion of the S&P Total Market Index.
Holdings may change daily. Holdings are reported as of the most recent quarter-end. None of the securities mentioned in the article were held by any accounts managed by U.S. Global Investors as of 9/30/2019.
U.S. Global Investors, Inc. is an investment adviser registered with the Securities and Exchange Commission ("SEC"). This does not mean that we are sponsored, recommended, or approved by the SEC, or that our abilities or qualifications in any respect have been passed upon by the SEC or any officer of the SEC. This commentary should not be considered a solicitation or offering of any investment product. Certain materials in this commentary may contain dated information. The information provided was current at the time of publication.
