by Pinchas Cohen
The global equity rally that took off on relief after France's first round presidential election—as investors either convinced themselves that centrist Macron’s victory is a forgone conclusion, or that May 7, the date of the second, decisive round, seems like an eternity away—continues on some actual business growth. To be fair, what's driving stock indices higher now is the lingering hope of US tax reform, with Trump set to announce his tax plan today, limiting the upper corporate rate to 15%.
In addition, as discussed yesterday, continued yen weakness will boost equities, which are enjoying their longest winning streak of the year.
The MSCI All-Country World Index—with $700 billion now infused—achieved another record high, of 456.60, and is holding its ground currently, trading at 456.23, only 37 points below. This follows strong global earnings across the board, such as by Germany's Daimler (DE:DAIGn) and Aluminum Corp. of China (NYSE:ACH) as well as Caterpillar (NYSE:CAT) and McDonald’s (NYSE:MCD). However, there is true global participation, as even emerging-market equities advanced to a near two year high.

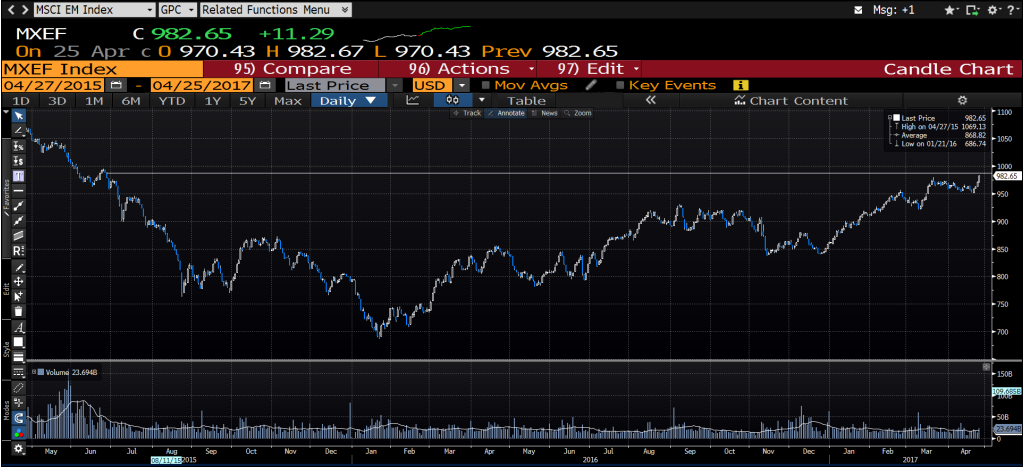
The MSCI Emerging Markets Index is currently trading at 982.65, only two points below its high, as traders are hanging on to this asset which is the highest it has been since June 26, 2015.
As far as safe havens go, while the yen has extended its declines, gold is holding on.
However, despite the high optimism in the media, European equities—while still mostly maintaining gains—are fluctuating between small declines and remaining flat. This, despite the fact that even their local currencies have declined. While the falling yen is boosting Japanese equities and Australia’s equities are rising proportionally even though its currency declined, that’s not enough for Europe.
Here are the facts:
Australia’s ASX 200 is up 0.70%, to 5912,036, while the AUD is down 0.60%, at 0.7494.
Japan’s TOPIX opened with a rising gap of 1.2%, as buyers chased up the price to find willing sellers; it's now trading at the top of its range at 1537.41 in a sign of strength. The yen is down 0.25% at 111.32.
However, even though the euro is down 0.28%, at 1.0900, the Euro Stoxx 50 is down 508 points, at 3578.08, the DAX and CAC are churning. Despite the fact that the pound is down 0.15%, at 1.2820, the FTSE 100 is flat.
US stock futures are mostly flat as well, as the S&P is down 0.07%, at 2,383.25, while the NASDAQ and the Dow are up, 0.02%, at 5,549.50 and 0.2%, at 20,949.00, respectively.
Equities
Yesterday, both McDonald’s and Caterpillar destroyed expectations. Both stocks surged after their reports.
McDonald’s reported an EPS of $1.47 vs $1.33, with revenues of $5.68 billion vs $5.53 billion, as expected by Thompson Reuters. Domestic same-store sales growth advanced 1.7 percent versus an expected decline of 0.8 percent.

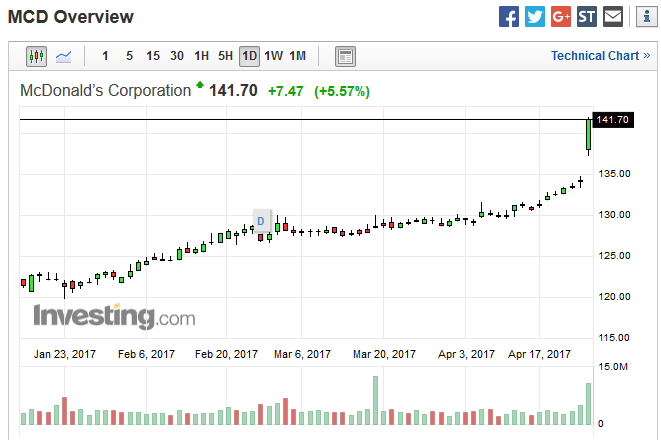
The fast food restaurant chain's shares opened with a 2.91% gap; clearly, everyone wanted a bite. Altogether, shares gained 5.56% on the day, closing at 141.70 after reaching a high of 141.99. Both the close and the intraday high are records. This marked the 7th consecutive record close for the stock. Price was supported by wide participation with a volume of 10.894M
Caterpillar reported and adjusted EPS of $1.28, making Wall Street's expectations of $.62 seem embarrassingly off, on revenue of $9.8 billion vs expectations of $9.4 billion. This achievement occurred thanks to old-fashioned cost-cutting. The construction and mining equipment manufacturer even raised its guidance for full-year earnings and revenue: earnings to $3.75 EPS, up from just $2.90 EPS; revenue to up to $41 billion, from just $38 billion.
Its shares leaped at the open with a gap of 5.36%, as investors bulldozed their way toward willing sellers; shares started the day at $102.88 and closed at 104.42, with a 7.58% gain, close to the intraday high of $104.89, as the bulls held on. This is the highest since November 2014, when it was ironically gapping down, within a falling trend which slipped all the way to $56.26, on January 20, 2016.
Commodities
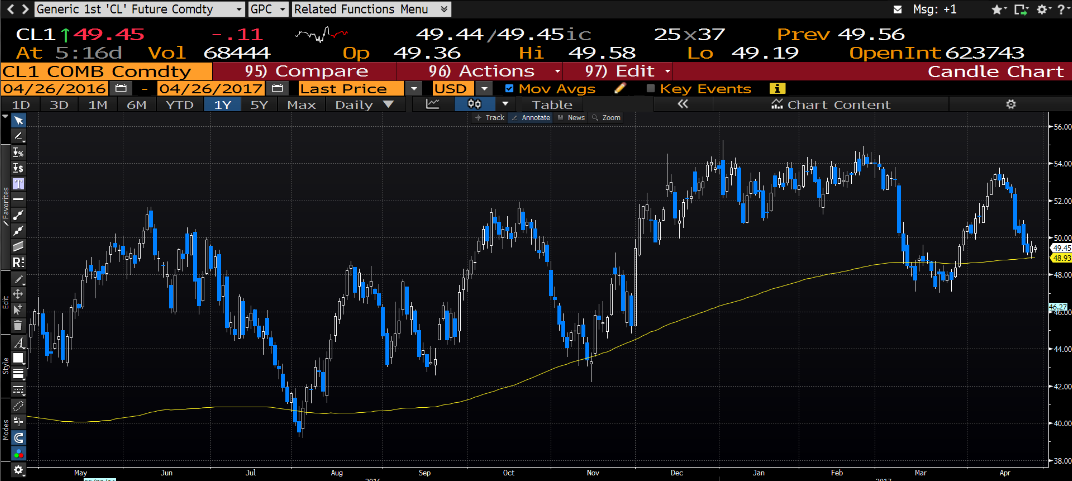
Yesterday, WTI oil's consecutive 6-day decline, and all-around 8 day decline of 8.44 percent, finally came to an end. Crude advanced 0.69% on the day. Currently it’s churning in place.

The question is whether it’s doing so in effort not to fall, or whether it’s revving up for a push higher.
It’s interesting to note that today’s churning is taking place on top of the 200-day moving average, which has been its ally and supporter since April, as it proved itself in May, November and March. However, for much of March it hung on to it from below. The 200-day moving average can be a powerful ally.
Bonds
Yields on 10-year maturities for the US, Germany and France, all fell one basis point. The Treasury note fell to 2.32 percent following a five day straight advance.
For the French sovereign bond, the decline to 0.89 percent comes after an advance of 7 basis points yesterday.
