-
US stocks complete third-day rebound despite escalating trade war saga
-
European and Asian stocks slip on Cohn's resignation, perceived Trump’s stubbornness
-
Yen surges to 16-month high
-
Oil extends losses on expectation of growing stockpiles
-
Gold slumps on dollar gains despite risk-off mood
-
Coinbase launches crypto weighted index
-
Bitcoin news push the digital currency toward $10K
Key Events
US equities advanced for a third day, even amid fresh signs that President Donald Trump remains steadfast on his protectionist path.
The S&P 500 gained 0.26 percent, led by growth sectors Materials (+1.09 percent) and Consumer Discretionary (+0.69 percent). The only two sectors in the red were Utilities (-1.34 percent) and Health Care (-1.55 percent)—both defensive. After Monday’s lack of leadership, it appears that equity traders organized themselves around risk. Tresaurys also sold off as investors rotated back into growth assets. The total S&P 500 rebound, into its third day, was 1.9 percent.
The Dow Jones Industrial Average was little changed, closing 0.05 percent higher and capping its second day of a rebound with a total 1.13 percent. The NASDAQ Composite added 0.57 percent, gaining 2.68 percent over its three-day rebound. The Russell 2000 outperformed its major index peers, jumping 1.11 percent, for a 3-day total rise of 3.56 percent.
Both the S&P 500 and the Dow closed lower than their opening price while both the NASDAQ Composite and the Russell 2000 extended their opening head-start to close higher. Except for the small-cap index, all the other three benchmarks formed hanging men, which, with a confirmation of a closing lower than their real bodies in the following session becomes a bearish signal.
Not only did the Russell 2000 avert the potential for a bearish candle, it also managed to close near the height of its session, demonstrating a lack of bearish resistance to the bullish advance.
We have repeatedly pointed out that the Russell 2000 often bucks the trend of larger cap stocks listed on the other three major US indices. These were the biggest beneficiaries of the pivotal tax cuts recently passed by Donald Trump's administration. Domestic companies don’t have the same resources or opportunities that multinational large caps have, so when the dominant theme is a trade war, the index featuring companies whose profits are not subject to exports is unaffected by the immediate risk.
Therefore, it grabs the largest slice of investor demand. Note that the bigger the market capitalization of a company, the more it relies on exports for its profits, thus the poorer its performance yesterday.
The same inverse relationship between the breadth of the rebound and the size of a company's market cap—with the larger-cap stocks posting a smaller bounce back—also applies for the bigger picture. When we consider the aggregate market move of the three-day selloff that followed Trump's initial announcement of his trade tariff plans (February 27 to March 1), we can see the Dow coming in 3.3 percent below its February 26 close, the S&P 500 1.88 percent below the close on the same day and the NASDAQ standing 0.65 percent away from its pre-trade-war selloff. The Russell 2000 outperformed its peers by recouping all losses and adding another 0.23 percent to boot.
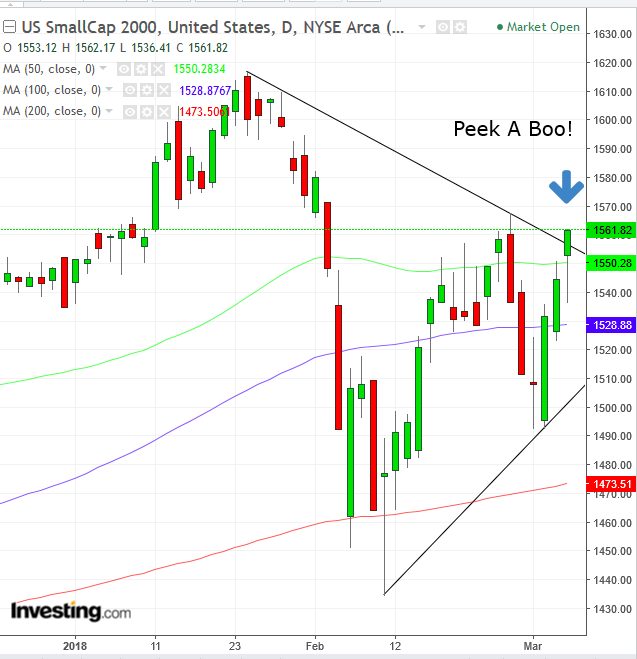
Technically, both the S&P 500 and the Dow are below the resistance of the 50 dma (green), while the NASDAQ crossed it on March 2 and the Russell 2000 closed above it yesterday. This also means that the small-cap index is the only benchmark to have crossed above its downtrend line since late January.
Stocks listed on all indices started falling after the open yesterday, but again, according to the size of their market cap. The Dow dropped for the first three hours of trading, the S&P 500 slid for the first two hours and the NASDAQ fell during the first hour, rebounding eventually to close higher, though it slipped again in the second hour of trade; the Russell 2000 fell in the first two hours.
Initially stocks fell on Trump remaining steadfast on his tariff plans. Then they rebounded during the third hour of trading (fourth hour, for the mega cap Dow Jones), when opposition from Trump's own allies mounted and an apparent diplomatic breakthrough in the Korean Peninsula boosted risk-on sentiment.
House Speaker Paul Ryan criticized the trade tariff proposal and urged the President to reconsider his stance. White House economic advisor Gary Cohn went as far as resigning over the issue. Republican Senator David Perdue of Georgia, who also opposes the tariffs, said after meeting on Tuesday with White House chief of staff John Kelly that the administration was willing to consider his views: "Absolutely. There's an openness now.”
All this resistance from his own party increases the pressure on Trump to backtrack from his original plan of imposing steep tariffs on steel and aluminum imports. Still, there has been no actual signal that Trump has backed down or is willing to.
Global Financial Affairs
This morning, European shares followed their Asian counterparts lower, alongside US equity futures, as Trump appeared to be hardening his position on taxing imports.
The STOXX Europe 600 Index headed for its first decline in three days, as most of its 17 sectors retreated. Indices in Asia also slid, as investors indicated they feared the implications of the departure of Cohn, a proponent of free-trade within the more protectionist Trump administration. His departure may now leave Trump and his advisors leaning toward an even stronger protectionist stance.
News that the White House is considering clamping down on Chinese investments and imposing broader tariffs added to the gloomy sentiment. S&P 500 futures plunged, though they later trimmed a decline that at one point was as big as 1.6 percent.
The prospect of increased protectionism overshadowed positive developments in North Korea, which had helped boost gains in US markets on Tuesday. Trump signaled that he is open to talks with the country after North Korean leader Kim Jong Un told South Korean envoys that he’s willing to consider a denuclearization program, under certain conditions. The South Korean won rallied on the news.
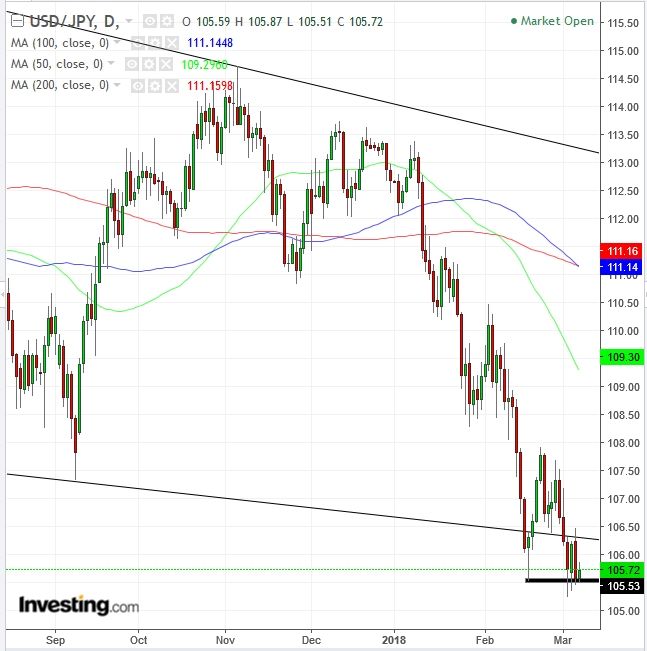
The yen rose to its strongest level in almost 16 months, thanks to its safe haven status. Technically, while a Golden Cross may happen with the 100 dma (blue) crossing below the 200 dma (red), placing the three major MAs in a bearish pattern, the February 16 hammer’s support is still holding. Once it breaks, the price will have cleared a falling channel, within which it has been trading since mid-December 2016.
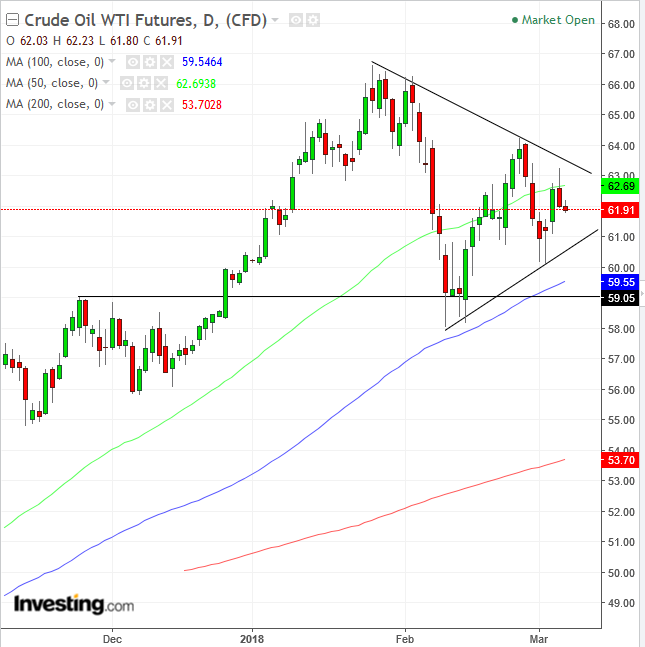
Oil extended a decline ahead of today’s EIA report that's expected to show US stockpiles expanded. Yesterday, API reported that US crude supplies increased 5.7 million barrels for the week ending March 2. Trade-war fears weakened most commodities.
Technically, oil's price extends its slide, upon finding a dual resistance by the 50 dma (green) and the downtrend line since January 25, the top part of a Symmetrical Triangle. Note that the 100 dma (blue) reveals the significance of the uptrend line since February 9, the lower boundary of the pattern, which is also supported by the November 24, $59.05 peak.
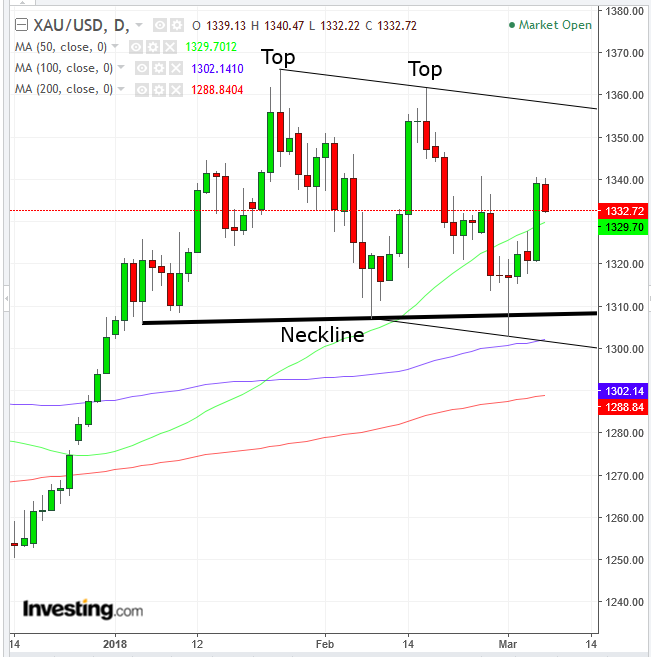
Gold edged lower, while the dollar eked out a gain. Technically, the price may be forming a Double Top or Complex H&S. The difference is academic, as they both carry bearish implications, upon a downside breakout of the neckline.
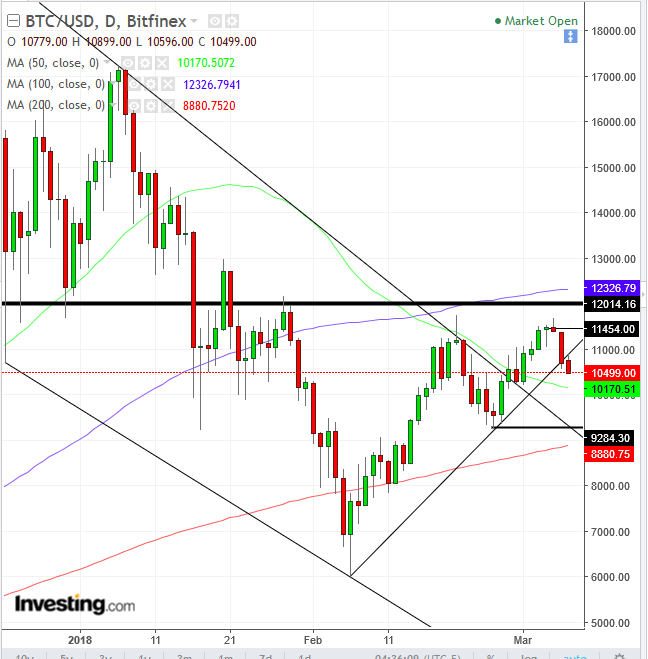
Coinbase is launching the 'Dow Jones' of cryptocurrencies—a weighted index fund intended to reflect major trends in the crypto market. The move would enable investors to gain exposure to crypto assets on the exchange.
The good news, however, may be overshadowed by a BBC Radio 4 investigation that found that a group of hackers and a UK company laundered 650,000 Bitcoin, worth 4.5 billion pounds ($6.23 billion) in 2014. The coins ended up at rival exchange BTC-e, according to the BBC report.
Technically the price crossed below its uptrend line since February 6, heading to the 50 dma (green), its last line of defense before the neckline of a double top.
Up Ahead
-
The Chinese People’s Political Consultative Conference runs through March 15 and overlaps with the National People’s Congress meetings in Beijing, through March 20.
-
The ECB isn’t expected to change policy on Thursday, but the Governing Council may discuss a change to pave the way for the end of quantitative easing.
-
BoJ monetary policy decision and briefing on Friday.
-
US monthly payrolls data come Friday.
Market Moves
Stocks
-
The STOXX Europe 600 Index dipped 0.2 percent.
-
Futures on the S&P 500 Index sank 0.8 percent.
-
The MSCI AC Asia Pacific Index decreased 0.6 percent.
-
The MSCI Emerging Markets Index declined 0.4 percent.
Currencies
-
The Dollar Index increased 0.15 percent to 89.55
-
The euro gained less than 0.05 percent to $1.241, hitting the strongest in almost three weeks with its fifth straight advance.
-
The British pound fell 0.1 percent.
-
The Japanese yen climbed 0.3 percent.
Bonds
-
The yield on 10-year Treasuries fell two basis points to 2.86 percent.
-
Germany's 10-year yield dipped one basis point to 0.67 percent.
-
Britain’s 10-year yields declined one basis point to 1.521 percent.
Commodities
-
WTI crude fell 0.9 percent to $62.03 a barrel.
-
Gold dipped 0.1 percent to $1,332.59 an ounce.
