- Europe, U.S. futures take a hit from tech firms halting business with Huawei
- Treasury yields pare last week's gains, potentially bottoming out - but later reverse on risk off shift
- WTI climbs on OPEC signals of continued supply cuts
Key Events
Europe's STOXX 600 and futures on the S&P 500, Dow and NASDAQ 100 took a beating this morning as weekend reports that Alphabet’s Google (NASDAQ:GOOGL) halted business with Huawei—including transfer of hardware, software and key technical services—finally took hold of the market, crushing tech shares.
U.S. contracts had initially pared losses after last week’s sharp decline, helped by the beneficial price effect of the White House's move to lift metal tariffs on Canadian and Mexican imports.
However, the rebound proved short-lived compared with the ramifications of last week's ban on Chinese telecom company Huawei, as other U.S. tech companies such as Qualcomm (NASDAQ:QCOM) and Broadcom (NASDAQ:AVGO) joined Alphabet in stopping all shipping from the Chinese smart phone giant.
Earlier, in the Asian session, regional indices closed well off their lows, as investors registered the likely election wins of conservative incumbent parties in Australia and India. India’s Nifty 50 leaped 3.60%, only a few inches away from its record closing price posted on April 16.
Hong Kong’s Hang Seng underperformed, dropping 0.57% to the lowest level since Jan. 30, nearing its 200 DMA.
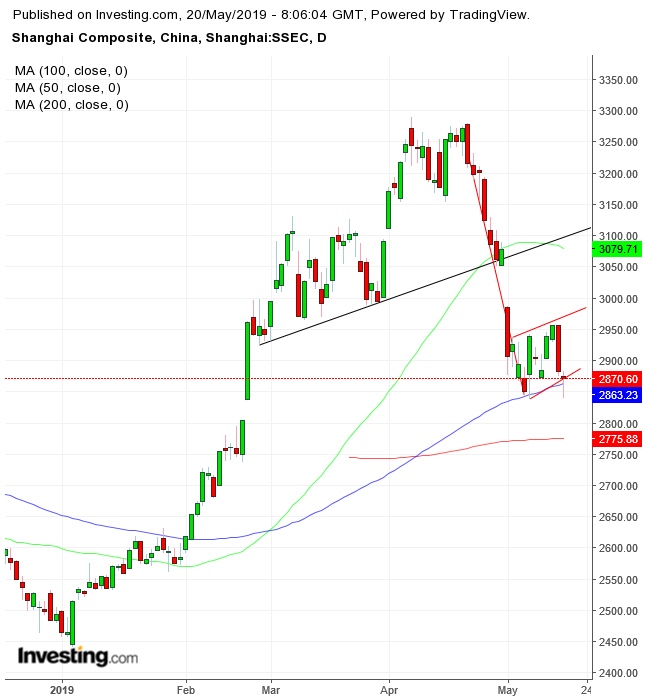
China’s Shanghai Composite closed 0.41% lower, limiting the damage of a 1.51% intraday plunge. Technically, however, Chinese bulls are expected to get slaughtered as the price develops a rising, bearish flag, after topping out. Today’s rebound was favored by the dual support of the 100 DMA on the bottom of the flag. Below lies in wait the 200 DMA. If prices fall below that, as the current pattern suggests, investors can expected to experience more pain.
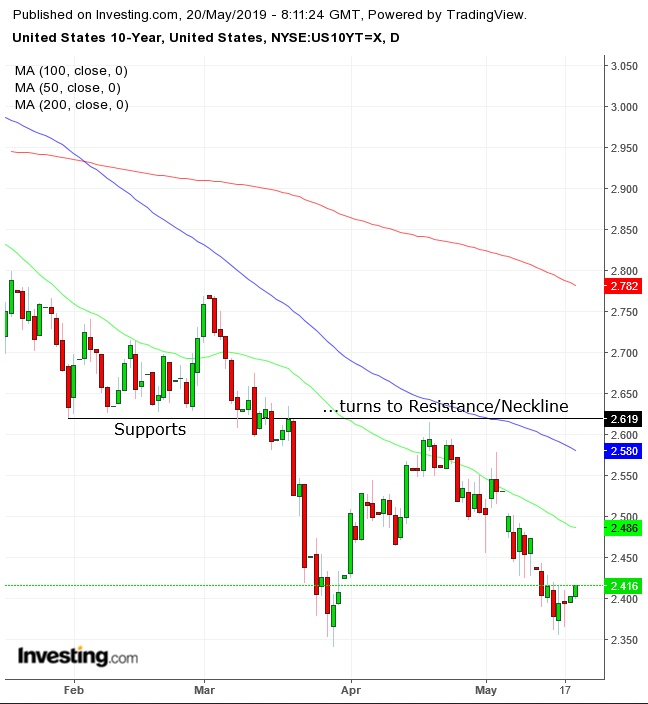
Meanwhile, the yield on 10-year Treasurys climbed for the third session out of four since touching the 2.350% level. We can call a bottom if it scaled above the 2.62% level, completing a double bottom.
Overall, if yields bottom out, they will also complete a massive falling, bullish wedge—demonstrating that all Treasury buyers have been pushed out, driving yields higher, and that the long-term uptrend since mid-2016 will resume after a medium-term interruption this year. However, until that happens, we remain bullish on bonds and defensive on equities.
Meanwhile, the Organisation for Economic Co-operation and Development slashed its economic forecasts, warning against the visible effects of a protracted U.S.-China trade dispute.
A slew of U.S. data this week, from home sales to manufacturing may offer clues on the economy's robustness against these trade headwinds. No doubt the Fed, which releases minutes from its last monetary policy meeting on Wednesday, will monitor the next batch of data closely to fine-tune its interest rate approach.
The Dollar Index pared gains after climbing every single day last week. Technically, the slide marks a pullback after the greenback completed an ascending triangle, demonstrating demand is progressively absorbing supply.
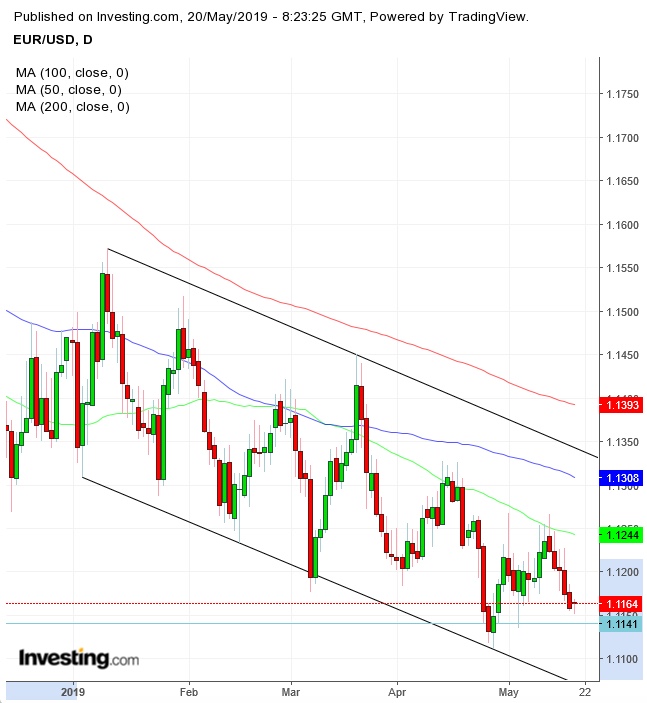
The euro managed to crawl into the green after edging lower, remaining under pressure ahead of European Parliament elections, which are expected to hand more power to Eurosceptic populist parties. The common currency is hovering only 0.2% above the lowest level since June 2017. Meanwhile, it trades within a descending channel of a pair of parallel trendlines demarking the respective territories of bears and bulls.
China’s offshore yuan strengthened to the highest level since Nov. 20, posting some relief after trade turmoil dragged down the currency to a five-month low.
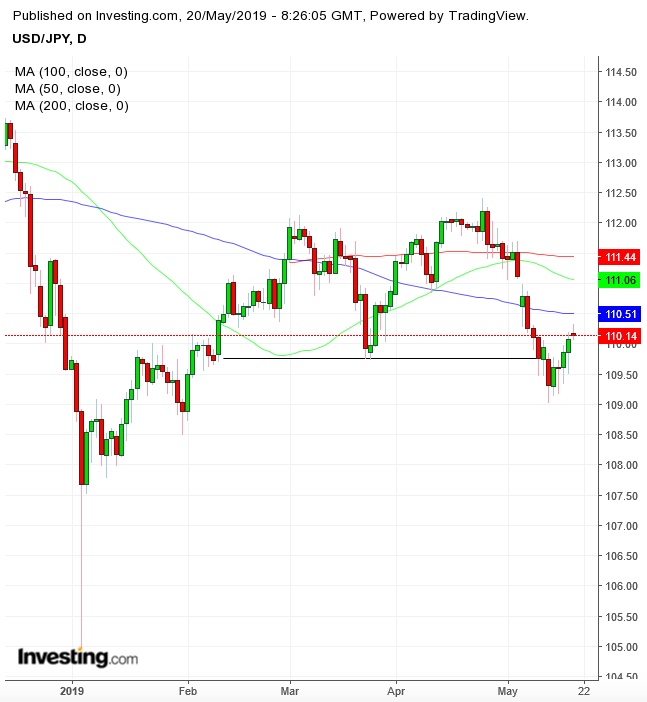
Conversely, the yen slipped as economic data showing unexpected growth in Japan came with reasons for caution, masking a drop in imports. Technically, the price is forming an intraday shooting star below the 50 DMA, suggesting the price might fall again below the neckline of a potential double-top.
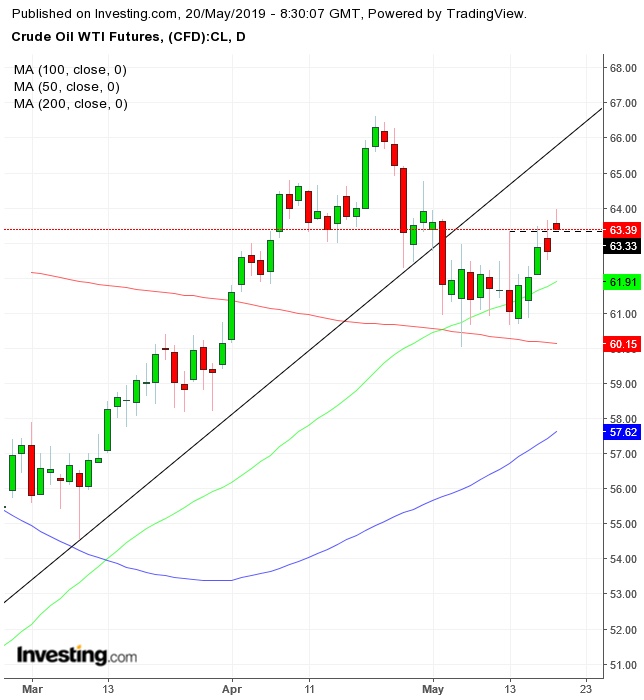
Elsewhere, crude climbed after Saudi Arabia and other key OPEC producers signaled their intention to keep oil supplies constrained for the rest of the year, while pledging to prevent any risk of shortage. Technically, the WTI price gave up its intraday highs, forming a shooting star—which would only be confirmed by a closing price—and pointing at the resistance of its prior uptrend line since the December bottom. For now, the May 13 highs are providing a support. The black gold provided a positive signal last week when it triggered a golden cross, when the 50 DMA crossed over the 200 DMA.
Up Ahead
- Home Depot (NYSE:HD) reports Q1 earnings before market open on Tuesday. Some analysts are pointing out that the housing slowdown and weather headwinds will probably only mark short-term setbacks for the largest U.S. home-improvement retailer.
- Bank of England Governor Mark Carney testifies to Parliament about the May inflation report
- Also on Tuesday,Reserve Bank of Australia Governor Philip Lowe speaks in Brisbane.
- Minutes from the April 30-May 1 FOMC policy meeting will be released on Wednesday.
- Counting of votes from the Indian general elections takes place on Thursday as Prime Minister Narendra Modi attempts to secure a second term.
- ECB President Mario Draghi speaks in Frankfurt on Wednesday.
- The European Parliament holds continent-wide elections on May 23-26.
- On Thursday, the ECB publishes its account of the April monetary policy decision.
Market Moves
Stocks
- India’s Sensex Index jumped 3% and headed for its the largest climb in more than three years.
- The MSCI Emerging Market Index gained 0.1%.
Currencies
- The Dollar Index dropped less than 0.1%.
- The euro dropped less than 0.05% to $1.1157, reaching the weakest in almost three weeks.
- The Japanese yen fell 0.1% to 110.18 per dollar.
- The Australian dollar rose 0.8% to 0.693 per dollar, the biggest rise in 15 weeks.
Bonds
- The yield on 10-year Treasurys gained one basis point to 2.40%.
- The yield on 2-year Treasurys rose two basis points to 2.21%.
- Germany’s 10-year yield rose one basis point to -0.10%, the largest advance in two weeks.
Commodities
