This will be a simple, straightforward post: just a look at the Dow Jones Composite with a short-, medium-, and long-term view.
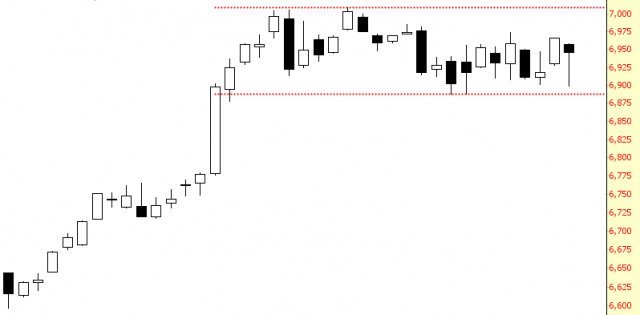
The short-term view reveals something which has been the case for many indexes lately – an entire month – – a whole stinkin’ month – – of going nowhere. You can see the upper and lower bounds of this range, and many indexes (including the Dow) look exactly like this. After the Trump victory, the market doesn’t quite know what to do with itself.

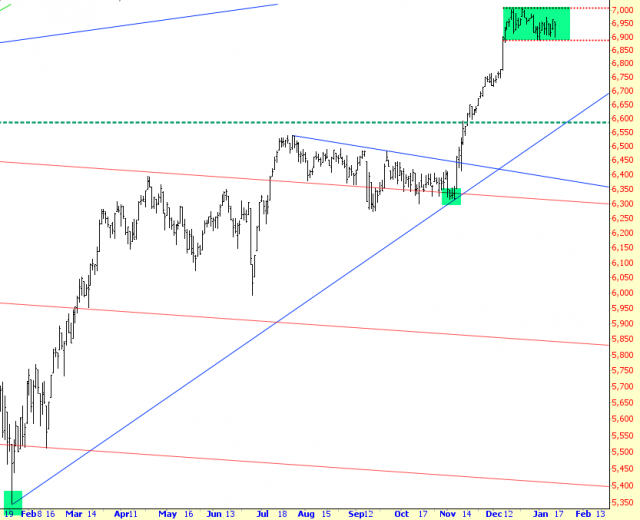
Taking a step back, though, you can see how vulnerable things are. I’ve tinted this month-long range below, and if we slip beneath it, it opens up the floor to a drop down to that supporting trendline. Earnings might do it; the realization that this country is completely screwed under Trump might do it; who knows.

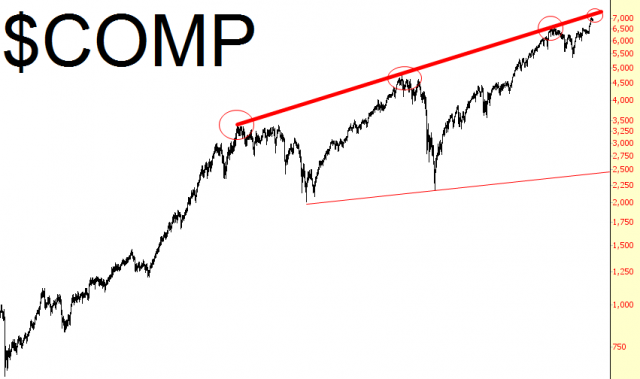
Stepping way, way back, you can really appreciate just how elevated things are. Keep in mind, the Dow Composite is a roll-up of the Industrials, the Utilities, and the Transports, so it’s a pretty good all-encompassing view. We should have started dropping after December 2014, and indeed, we began doing so – – – – but twenty trillion dollars in debt can keep this fakery going longer than you might imagine, so we can an additional leg-up. All the same, present price levels are mashed up against a resistance trendline that goes back for decades.

That’s it for now; see you Friday morning!
