After dipping into negative territory crude is back at $40. What does that mean?
Oil analyst Phil Flynn says:
"The road back to $40-a-barrel oil was fraught with fear and uncertainty, but eclipsing that benchmark indicates the beginning of a strong recovery from the economic shutdown. The global economy crashed to a screeching halt as the coronavirus shut down the world, causing global oil demand to crater like never before."
Overthinking Or Underthinking Oil?
I am not sure which of these Flynn did, but I am sure it's at least one of them.
No Jobs Recovery
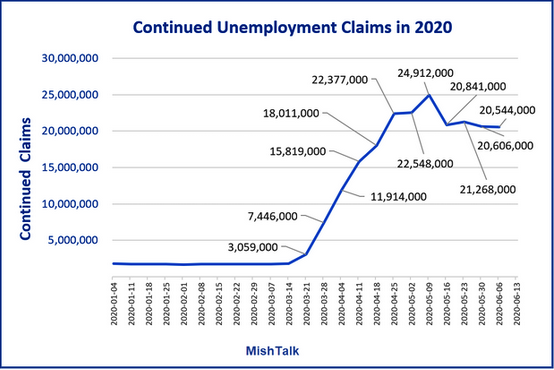
There was no jobs recovery. Continuing unemployment claims tell a bleak story.
For 7 consecutive weeks, continued unemployment claims have topped the 20 million mark.
Historical Perspective
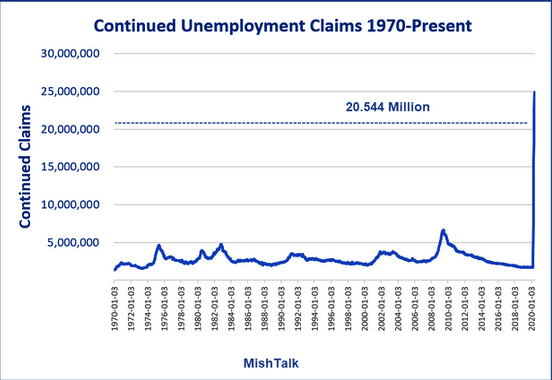
Continuing claims only topped the 5 million mark in the depths of the Great Recession.
Retail Sales
On June 16, I reported retail sales had surged by the most on record, but this number is misleading.
- Retail sales surged a greater than expected 17.7% in May, but the numbers are still well below the pre-pandemic levels.
- Despite the surge, sales numbers are back to levels seen in late 2015 and early 2016.
People got money and spent it, but they also skipped mortgage payments and credit card payments.
What happens when the checks run out?
The Myth Of The V-Shaped Recovery In One Chart
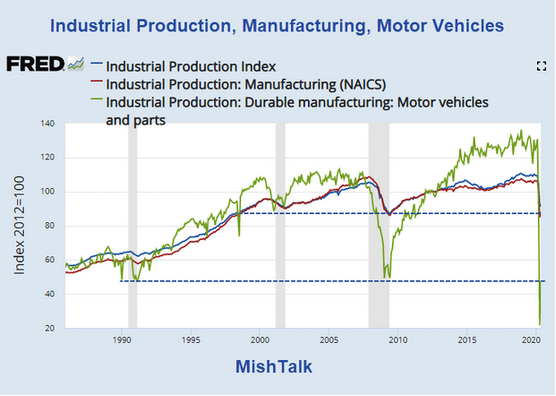
Manufacturing tells the same story as claims. The Fed's Industrial Production and Capacity Utilization puts a big negative spotlight on the emerging V-shaped recovery thesis.
Housing Starts
Comparisons
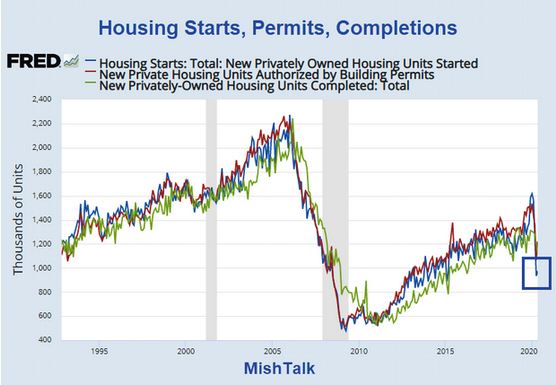
- In January of 1959 there were 1,657,000 housing starts.
- In May of 2020 housing starts reached 974,000.
- The number of housing starts in May 2020 were 41.8% below the level in January 1959.
- The recessions in 1960, 1970, and 1980 had better numbers.
For details and more charts, please see Housing Recovery Not Much to Crow About.
What's Really Happening?
- Fed's new facility will buy junk bonds with 7-1 leverage
- ZeroHedge reports Hedge Funds Go "All In" As Net Leverage Hits 99%
Biggest Speculative Bubble in History
The Fed has unleashed the biggest speculative bubble in history. There no true price discovery on stocks, junk bonds, or oil.
In regards to that latter, some 20 million people are out of work and not driving to jobs they do not have. Still more are working from home.
Industrial production and air traffic represent two more non-recovery oil usages.
US Oil Production
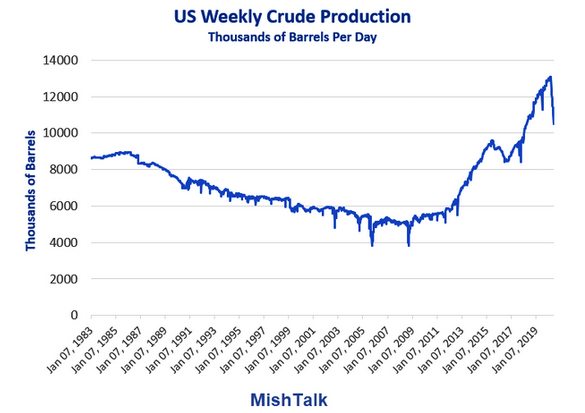
US Oil Production March-June 2020
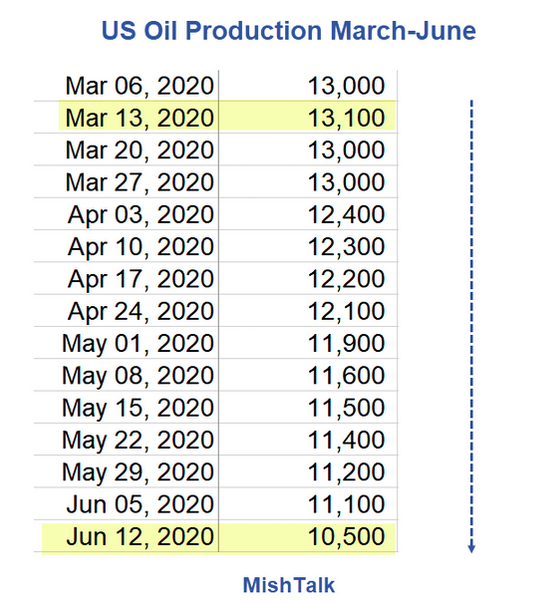
Data from the Energy Information Administration.
Why is the Price of Oil Up?
- Speculation is up
- Production is down
US oil production has fallen for 13 weeks since the peak on March 13.
Production has declined by nearly 20%, from 13.1 million of barrels per day to 10.5 million barrels per day.
The price of oil can stay high as long as production does not exceed storage capacity.
Overthinking or Underthinking?
How about overthinking the recovery and underthinking production?
