There are now two central banks joining the early Christmas present stimulus program. By the end of the week there could be three, with a fourth not moving on rates until mid-2016.
The European Central Bank (ECB) clearly started the risk-on excitement in the equity market with confirmation that the governing council is reading monetary policy for further stimulus. That will mean negative deposit rates are likely.
PBoC trumped this action on Friday night with an actual physical move to policy – cutting the one-year lending and deposit rate by 25 basis points (bps) and slashing the reserve requirement ratio (RRR) by 50 bps (coming into effect from 24 October). It also added furthers cuts to lending rates and the RRR for certain institutions (the co-ops).
The estimated cash released from these policy changes is RMB600 to RMB700 billion in liquidity (approximately US$93.75 to US$109.3 billion). Considering the CPI reads and the industrial production reads over the past quarter, this should be no surprise. In fact, the surprise is that it’s taken this long for the PBoC to pull the trigger.
What might be missed by the headline reads is that the PBoC has abolished the deposit rate ceiling – this is a big step forward in liberalising the interest rate market and shows China is very much committed to its goals of liberating the financial system.
What’s catching my attention
Do the moves by the ECB and the PBoC see the Bank of Japan (BoJ) joining the party and adding to its already massively stimulated economy? I would suggest so.
Do the Fed’s dot plots on Thursday morning show that the board is no longer raising rates in December? The data, USD and corporate earnings all suggest that this is a logical conclusion.
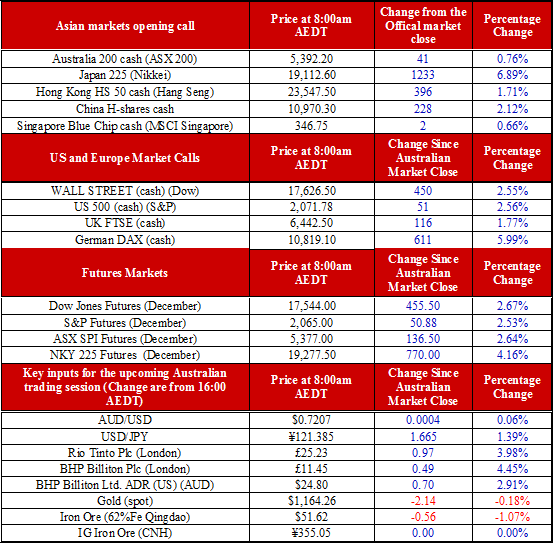
The effect of all this stimulus for risk-on investment is telling. After having the worst quarter since 2011 in Q3, the US is on track for its best month since 2011 and its best start to Q4 since 2011 as well. Since the lowest point in the S&P 500, the market has rallied over 11%.
US earnings season reversed the fortunes of the week before, with the percentage of companies beating estimates on the revenue line now back above 50% and the EPS line still above 70%.
The S&P/ASX 200 over the month of October has added 6.6%. However, from the 29 September collapse where ‘$44 billion was wiped off’, the ASX has added 8.8% or $129 billion back in market value.
Risk-on is spread fairly evenly. In the last 26 days, the energy sector has added 12.6% and the materials sector 9.9%. However, the cyclical space is not the only place that has benefitted from the change sentiment, with financials up 6.8% and consumer staples 8.4%; the ‘worst’ major sector over the past 26 days is healthcare with a 2.7% gain.
The ASX is pointing higher by 41 points to 5392 – that would see the ASX back in the black for 2015, joining the S&P in the same scenario. If the BoJ and the Fed moves like the market expects, risk-on will only gather momentum into the close of October.

