In particularly difficult market conditions, Numis (LON:NUM)’s franchise strength and maintenance of the compensation ratio softened the impact of lower investment banking and equities revenue. Earnings per share were still down by two-thirds compared with H118 but, looking ahead, a return to a more favourable environment should allow Numis to deliver attractive returns on equity once more (historical five-year average c 20%).
H119 results
As foreshadowed in the March update, H119 trading was affected by the uncertain UK political background and equity market volatility. Compared with H118, overall revenues were down 25% within which investment banking was down 24% and Equities 28%. The adverse background did not stop further growth in the franchise with the corporate client count increasing by a net six companies to 214. A reduction in variable compensation allowed the compensation ratio to be held stable at 54%, despite an increase of 14% in the average headcount following last year’s investment in hiring to support future growth. Even so, underlying operating profit was 58% lower and pre-tax profit was down 64% to £7.1m. Diluted EPS was 5.0p vs 14.6p, while the interim dividend was unchanged at 5.5p.
Outlook
The timing and nature of an eventual resolution of the Brexit impasse should be a key driver of a revival in earnings for Numis and its peers. While this keeps being deferred it does seem plausible that there is a significant level of deferred corporate activity that will eventually be released as confidence returns. Even without this there is evidence in the first half that Numis’s investment in supporting its service delivery is helping limit the impact of reduced activity levels, especially in equity capital markets. The investment should also mean the group is well placed to take opportunities to increase market share over the medium to long term.
Valuation
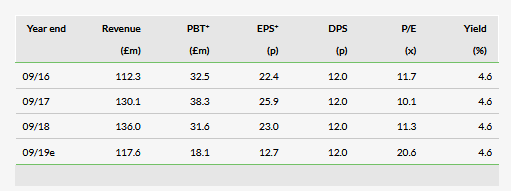
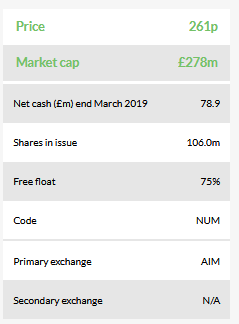
Our earnings estimate for FY19 has been reduced by 20% reflecting higher non-staff costs and more conservative revenue assumptions for H219. This points to a prospective ROE of 10% for the current year whereas a ROE/COE model suggests the market is discounting a return of c 16% at the current price. Given the historical five-year average of 20%, this still leaves significant upside as the market environment becomes less challenging.
Business description
Numis is one of the UK's leading independent corporate advisory and stockbroking groups, offering a full range of research, execution, equity capital markets, corporate broking and advisory services. It employs over 270 staff in offices in London and New York, and at the end of September 2018 had 210 corporate clients.
Key points from H119 results
As noted, group revenue was 25% lower than H118 within which investment banking was down 24% and equities 28% (see Exhibit 1 for details). The first half of last year was a tougher comparative period for investment banking than the second half and, sequentially, its revenues were just ahead of H218, with a pick-up in M&A advisory fees and private capital markets offsetting much-reduced IPO activity. This was a creditable performance in a period in which Numis notes that overall UK equity capital markets activity was approximately 50% lower (H119 versus H218). Average deal fees matched the level for FY18, reflecting deal size and the seniority of roles secured: both potentially positive indicators and linked by Numis to the continuing strengthening of the quality of the client base. During the period the market capitalisation of clients added was above those leaving, with an average for all clients of £836m versus £711m for H118. The 214 corporate clients at end H119, a net increase of six since H118, included six FTSE 100 index and 48 FTSE 250 constituents.
Within equities, institutional commissions were down by 12% reflecting lower trading activity but still robust payments for research with Numis looking for these to be broadly maintained for FY19 as a whole. Trading income (-92%) was affected by the trading background but was particularly impacted by a rare underwriting loss of c £3m (before related corporate fee) associated with the Kier rights issue during the period.
The other operating income line moved from a positive £0.4m contribution to a loss of £1.4m. This arose from a £0.9m write down on unquoted investments and a loss of £0.5m on the one remaining quoted investment. This left total income down 27% compared with the prior-year period.
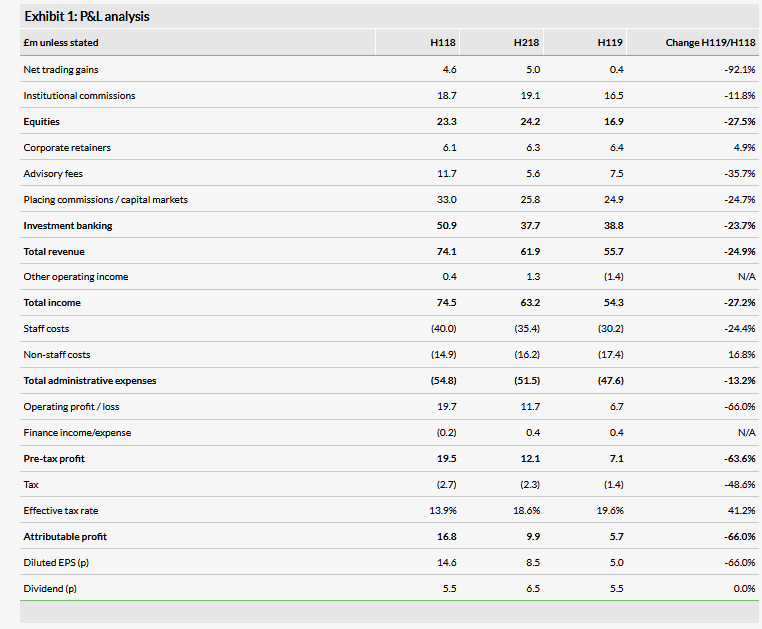
Turning to expenses, the level of staff costs was 24.4% lower as a reduction in variable compensation allowed the compensation ratio to be held stable at 54%, despite an increase of 13.5% in the average headcount following last year’s investment in hiring to support future growth. Although further additions may be considered if market conditions provide good opportunities, the group does not expect a material change in staff numbers during the second half.
In contrast, non-staff costs saw increases of 16.8% and 7.5% compared with H118 and H218 respectively. This was driven by a combination of the costs associated with the increase in headcount, including additional data services, an element of one-off data-related fees arising from a periodic audit of usage and continuing spending to strengthen systems supporting regulatory compliance further. Operating profit was 66% lower, 58% on an underlying basis, excluding gains or losses from the investment portfolio. Pre-tax profit was down 64% to £7.1m and diluted EPS was 5.0p vs 14.6p; the interim dividend was unchanged at 5.5p.
Background and outlook
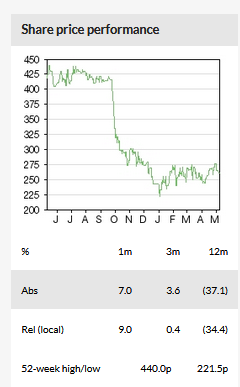
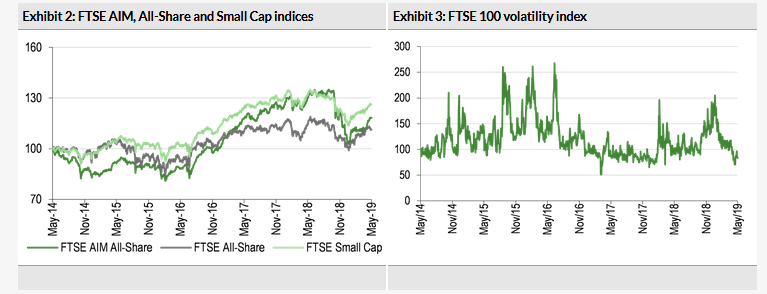
Recent equity market trends are shown in Exhibits 2 and 3. The sharp decline in equity indices in the final quarter of calendar year 2018 and the subsequent recovery and pull back in volatility are clear. The first chart also illustrates the outperformance of the FTSE SmallCap index compared with the All-Share and AIM All-Share indices over the five-year period shown. At the time of writing the All-Share and SmallCap indices were down modestly, whereas the AIM /All-Share was down 12% for Numis’s financial year to date. Compared with the final quarter of calendar year 2018 this creates a potentially more positive background for corporate activity once political uncertainty subsides.
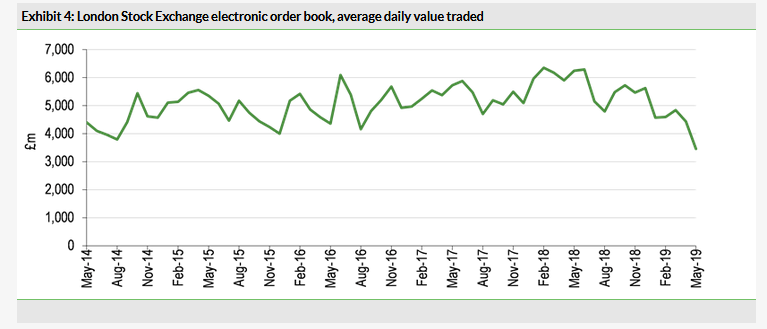
As shown in Exhibit 4, the average daily value traded on the London Stock Exchange order book has been on a downward trend in recent months. A cautionary note for the near term but this could reverse quickly given greater market confidence on the macro outlook and Numis indicated that April trading in equities continued at a similar level to the first half.
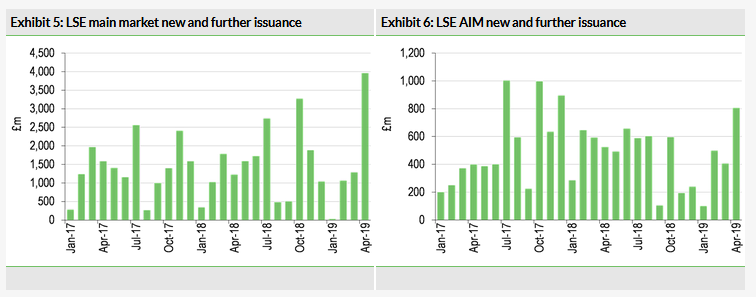
The LSE’s new and further issuance figures for the main market and AIM (Exhibits 5 and 6) show the very subdued background in Numis’s H119 and some revival in activity in April. For the main market much of this value related to a placing by Astra Zeneca (£2.9bn). Numis has reported that it completed a number of transactions in April, although they have been generally lower value fee events. Nevertheless, the pipeline is promising, with a greater number of M&A opportunities offsetting a reduction in the number of IPOs in the pipeline. The breadth of the pipeline has narrowed somewhat so the near-term outcome is even more uncertain than usual, depending on the incidence of specific completed transactions.
Greater political certainty remains elusive but we see the prospect a significant revival in activity once it arrives as plausible, and Numis’s investment in its franchise leaves it well positioned to take advantage of opportunities as they arise. This should allow it to generate significantly more attractive returns on equity than during the first half (8% annualised compared with the historical five-year average c 20%).
Strategically, the group remains committed to its vision of creating the investment bank of a generation by building the size and quality of its franchise, becoming the leading UK equities platform, developing complementary products/services, maintaining operating/capital disciplines and delivering shareholder returns (for more details see our January note).
Financials
We have adjusted our estimates to allow for the first-half numbers including a reduction in other income and somewhat higher non-staff expenses than previously. The continued deadlock surrounding Brexit has contributed to slightly more conservative revenue assumptions. Key lines from our estimates for FY19 are summarised in Exhibit 7 below. We look to put in place estimates for FY20 nearer the year end, potentially with the benefit of greater clarity on the UK political outlook.

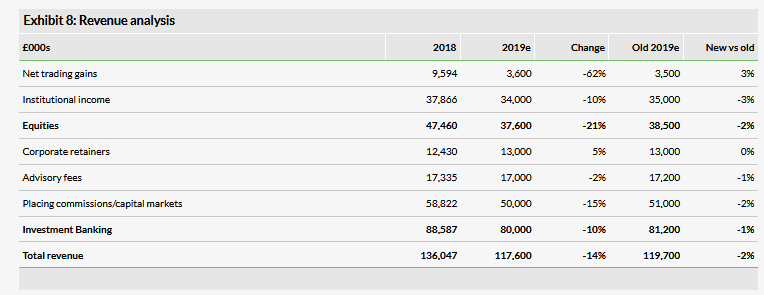
The modest reduction in our revenue estimate combined with a small increase in overall costs results in a 16% reduction at the operating profit level, which is amplified by the assumption of a loss rather than profit for other income resulting in 19% and 20% falls in pre-tax profit and EPS estimates respectively. A comparison of our segmental revenue estimates is shown in Exhibit 8 with further detail for the P&L, balance sheet and cash flow shown in the financial summary (Exhibit 10).
Regulatory capital is significantly higher than required providing stability and flexibility. At the half year end net cash stood at £78.9m (£82.5m H118 and £111.7m FY18) and additional liquidity has been provided by a new £35m credit facility that will further enhance the ability to engage in larger transactions. The facility is committed for three years and the costs associated with it are expected to be offset by the saving generated by Numis becoming a direct clearing member of LCH, a move that itself is enabled by the structure of the new facility.
Valuation
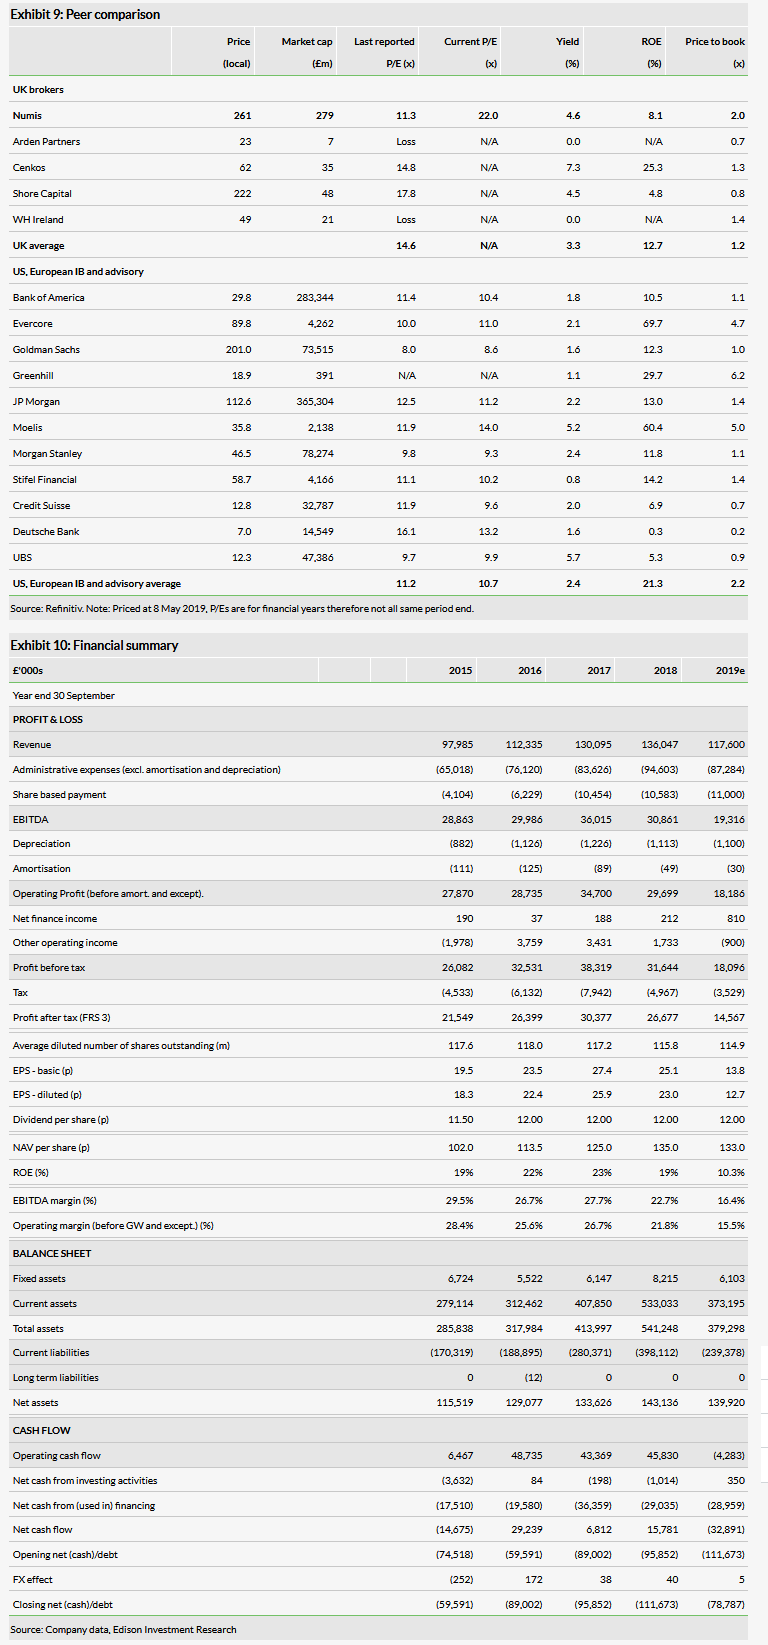
We have updated our peer comparison table in Exhibit 9; this includes UK quoted brokers and a selection of US and European investment banks and advisory firms. The absence of UK peer prospective P/Es and the continuing uncertainty of the political background means this measure is of limited use, although on our reduced estimate Numis trades well above its international peers. In terms of price to book ratio, Numis trades above the UK average but at a similar level to the international companies. We have shown the H119 annualised ROE for Numis of 8.1% but, as noted earlier, the five-year average return was 20%. At 261p a ROE/COE model suggests the market is discounting an ROE of c 16%, still leaving significant upside once trading conditions allow a return to previous levels of ROE.
