North and South Korean peace in the Horizon
The Leaders of the North and South Korea will meet on April 27, 2018 for the first time since 2007 and hope for North and South Korean peace, the two countries announced last month. The meeting between President Moon Jae-in and Kim Jon Un will be held at the Freedom House on the southern side of the Demilitarized Zone (DMZ), according to the joint statement issued after the talks. We understand the whole world will be looking at the summit, but most importanly the Technical Market is showing the outcome, which will result in a rally across the Market and weakness in the Yen. So, all will be good news. Many fundamental traders look at events like this to trade, but we look at the sequences and cycles and also at The One Market concept to look for trading opportunities.
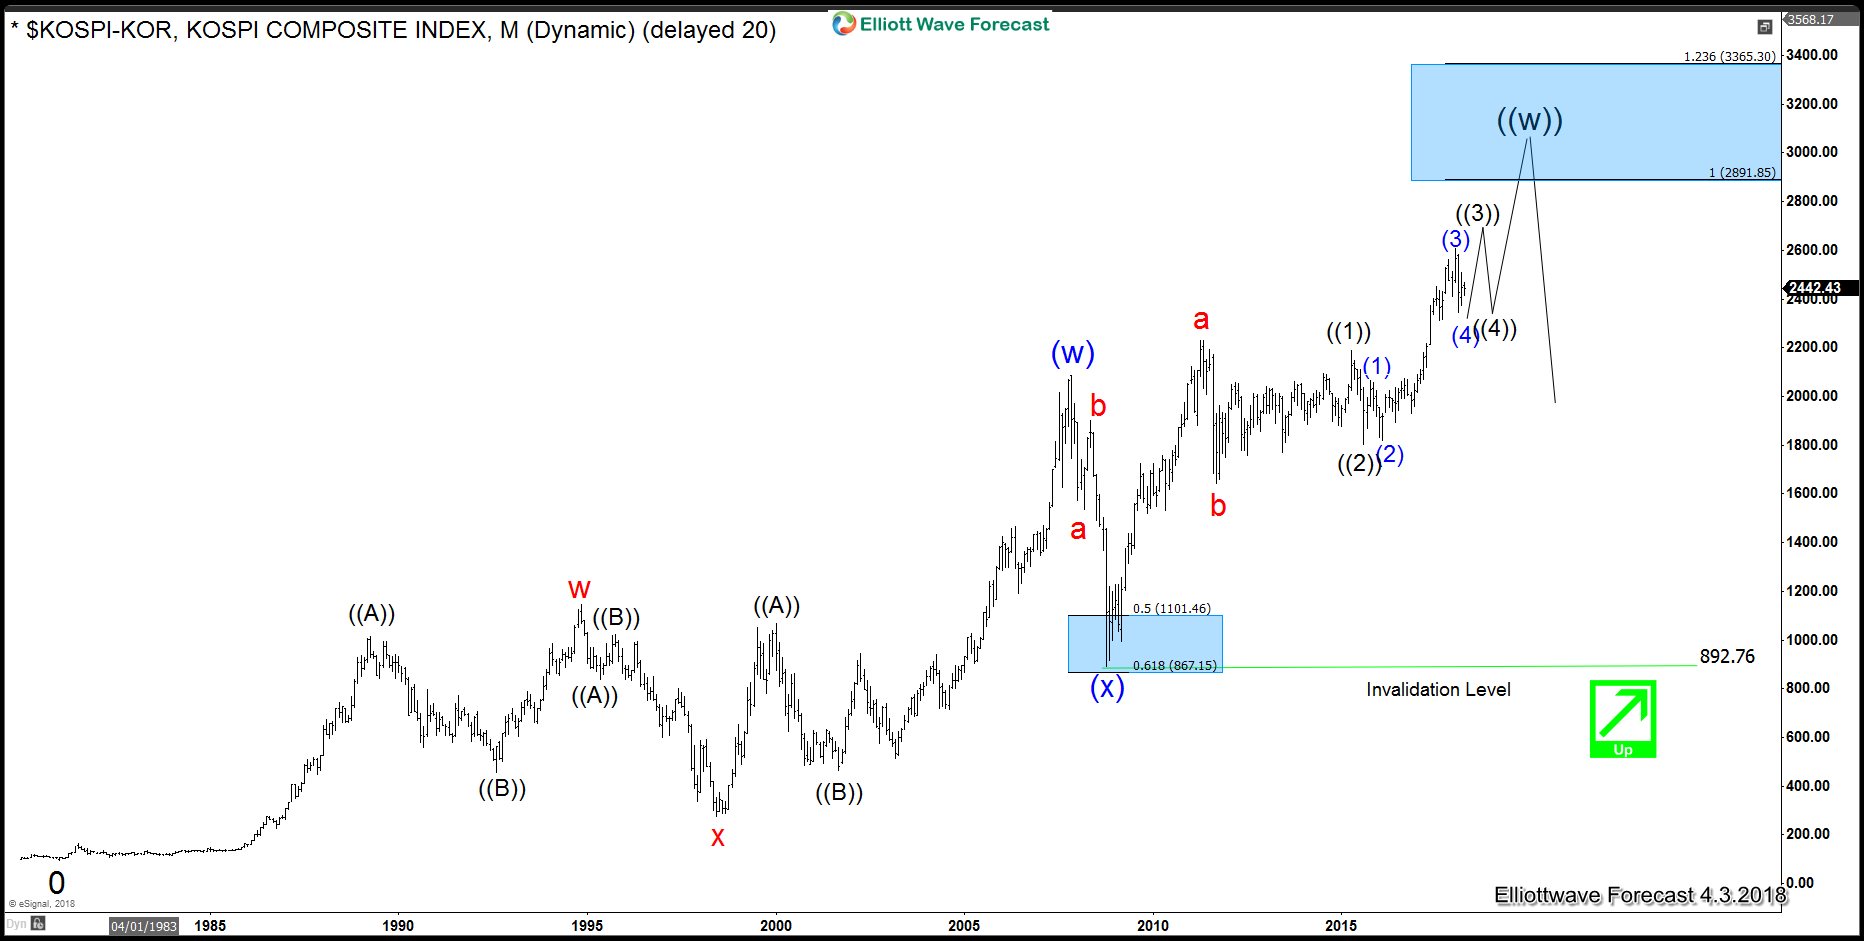
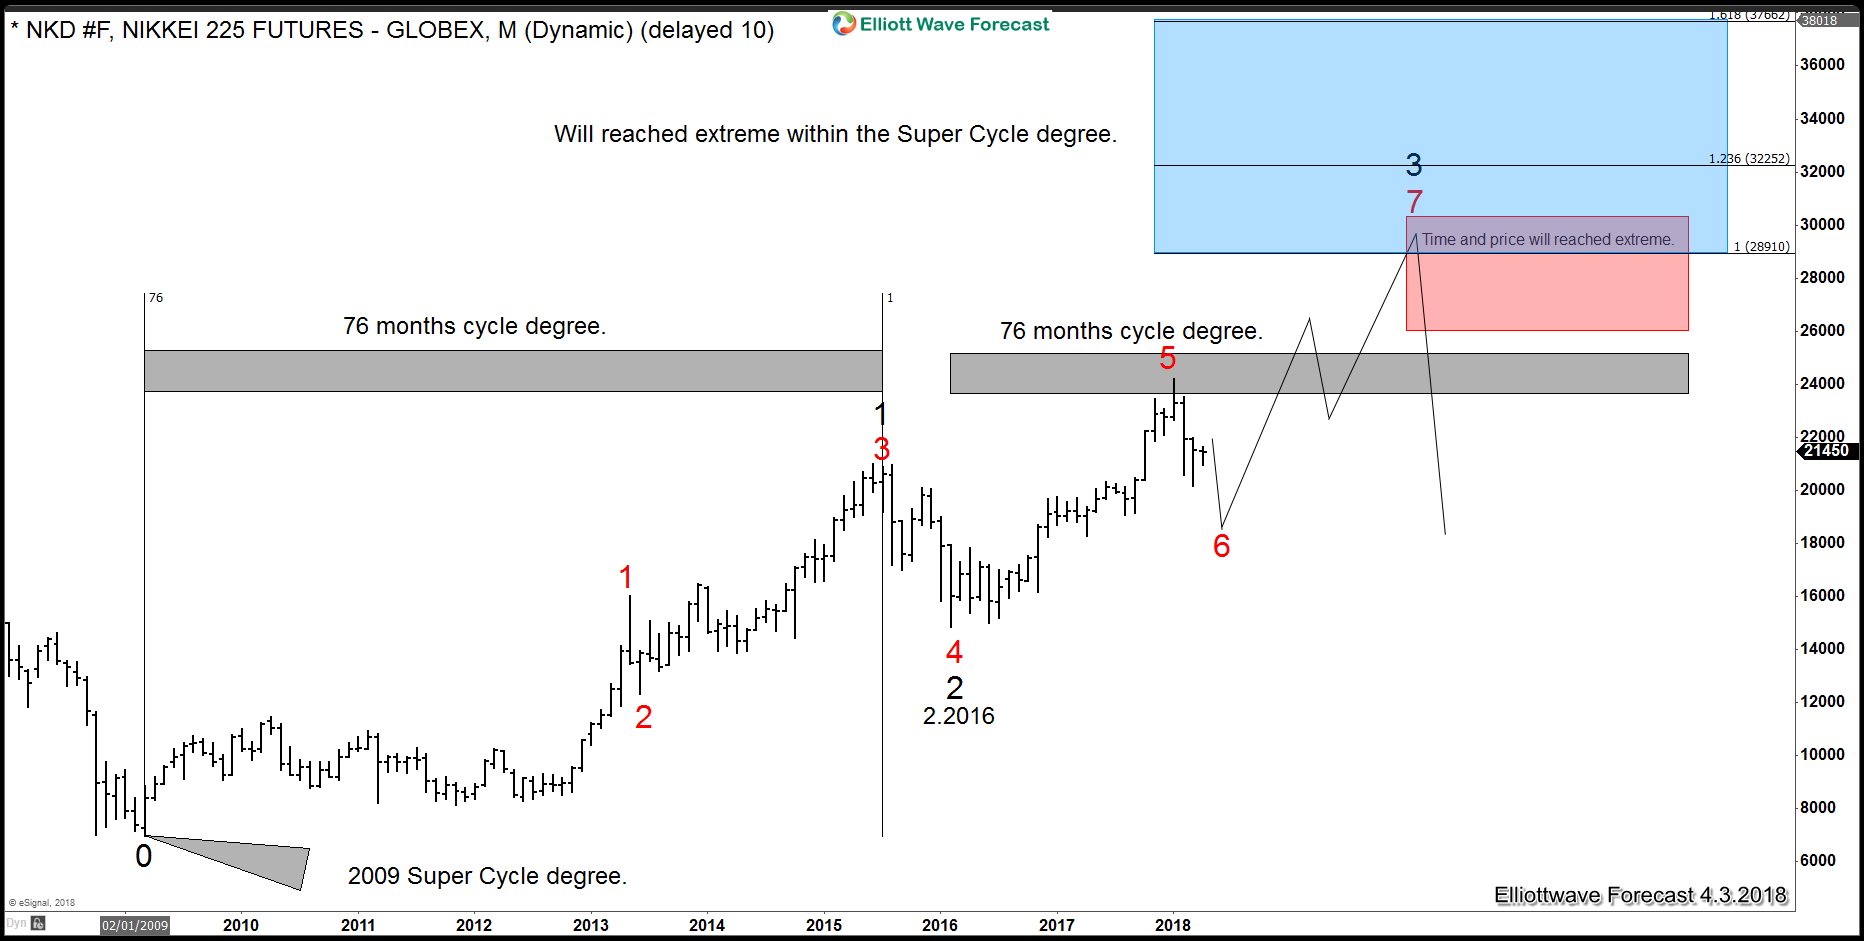
The Nikkei Index from Japan is showing a multi-year bullish sequences which started at 2009 low and is currently in the 6th swing of the sequence. This calls for more upside towards 28764 technical level ideally by 2020-2020, the rally in the $Nikkei will mean the YEN will be weak for at least 2 years and consequently the World Indices will rally. $KOSPI ( KOSPI Composite Index ) which is the Index from South Korea also is in need of more upside which is supporting the sequences in the $Nikkei and should be reaching the 100% Fibonacci extension of the rally from 1980 low related to 2008 low. To explain better the Summit, which appears to be a sharp contrast to 2017 when the peninsula appeared to be in a conflict mode, has nothing to do with the Market. That was used as an excuse for many market selloffs, but the truth is that the market continues to be very technical and is pointing to another rally which makes the case for a positive outcome in the Summit. Besides the Summit between the two Korean leaders, later the North Korean leader will meet with President Trump, which should ideally provide further fuel to the rally, so $KOSPI will rally into the 2891-3365 by 2020-2020, then something will happen around the World to justify another Market correction like in 2017 the escalation of of missiles and nuclear tests did. The Fire and Furry by President Trump justified the selling in early 2018. At the end, the Market is purely technical and Political events are nothing more than events which are used to fill the headlines by the Market Makers.
The following chart shows the Elliott wave count in $KOSPI since 1980 and the target which should be seen by 2020-2022, the Index is currently, like every world index, in a correction since 1.2018 and should rally soon, maybe by the Summit end around 4.27.2018 which coincides with the window for a turn in our timing cycles which lies between 4.25.2018 and 5.5.2018.
$KOSPI Long-Term Elliott Wave Analysis
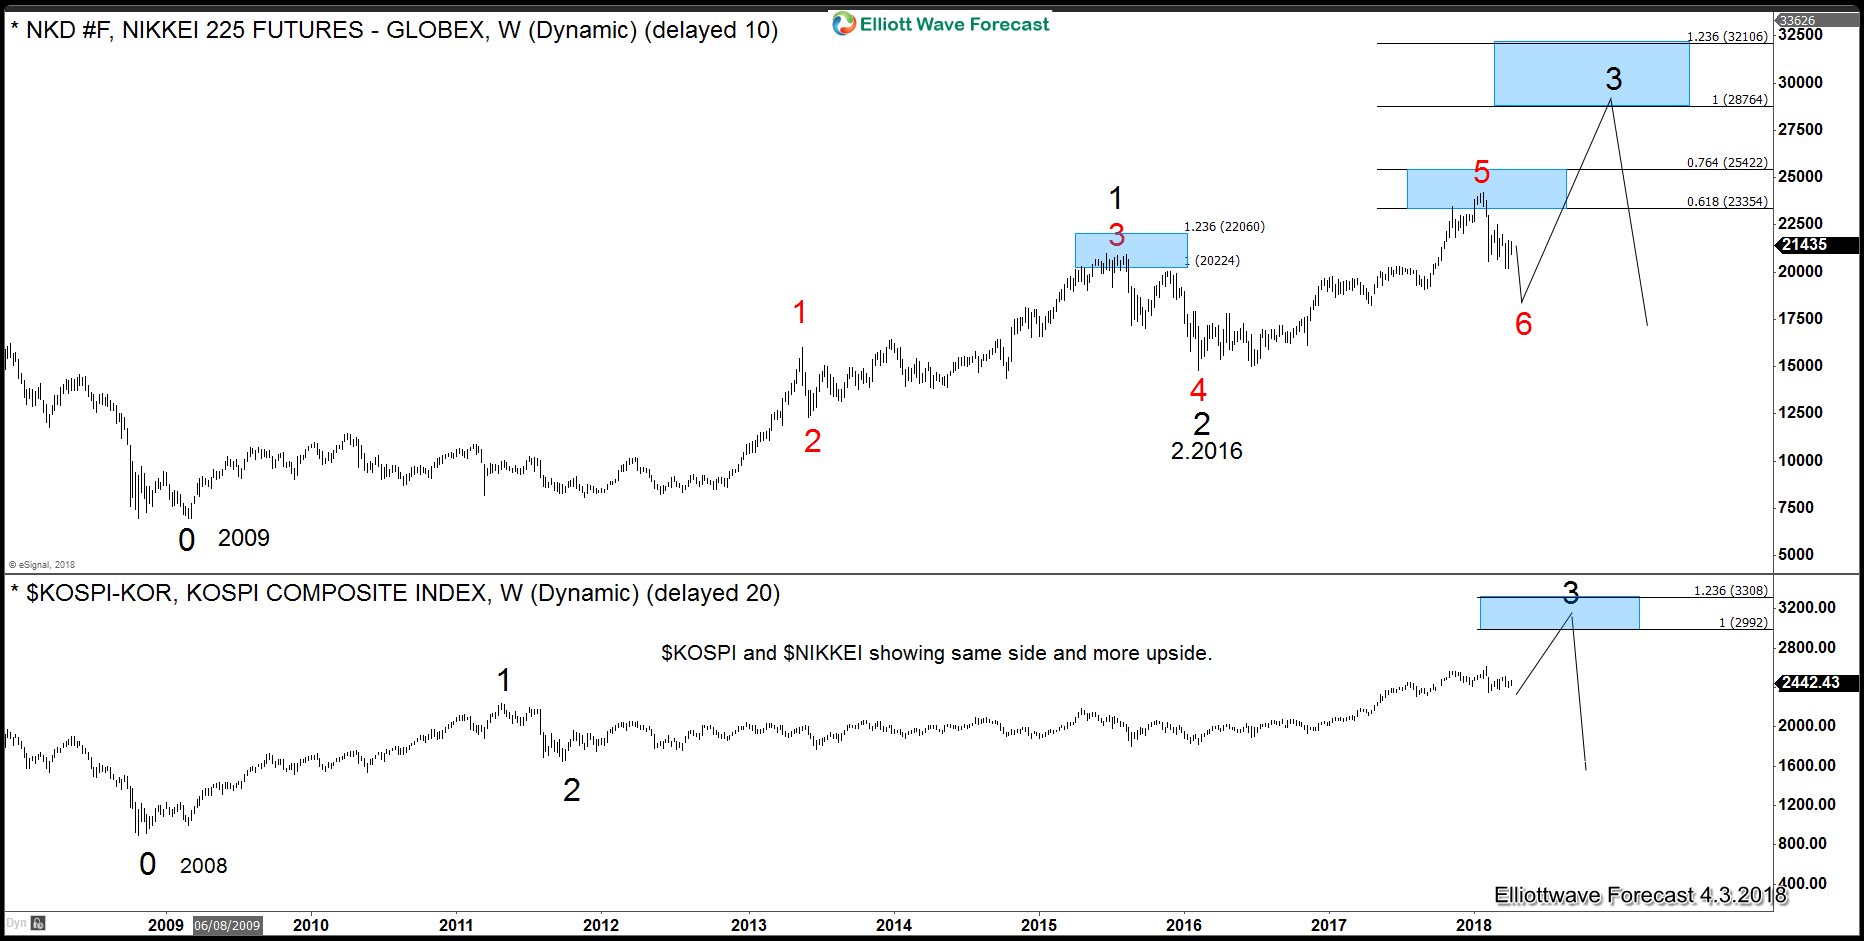
The Following chart shows the Weekly Elliott wave sequences in Nikkei showing the target and the current correction which also should end by the time the minor wave (4) ends in $KOSPI.

The Following chart show the overlay of $NIKKEI and $KOSPI showing The One market Only concept and the direction in both Indexes.

Our strategy remains to buy the dips and let the Summit to fuel the rally which will happen not matter what the result. The Elliott wave Technique we use is favoring an outcome from the Summit which would be favorable to the World Indices and thus, the Horizon for the North and South Korean peace is looking good.
