Let me be quick to acknowledge that yield curve inversion can have considerable lag time before a recession. And for that matter, the U.S. Treasury bond curve can invert long before a stock market bear.
For instance, 10-year yields fell below two-year yields in February of 2006. That was approximately 22 months before the recession officially hit in December of 2007. What’s more, between 2/2006-10/2007, the S&P 500 managed to climb more than 20%.
There’s more. The 1990s Treasury bond curve first inverted in June of 1998. The recession did not begin until March of 2001. And we already know that the S&P 500 tacked on roughly 40% from 6/08 to the 3/2000 peak; the index picked up closer to 12% if one waited until the official recession inception.
Nevertheless, investors should not be quick to dismiss the message of flattening yield curves that invert. Specifically, when short-term interest rates exceed long-term ones, financial markets perceive weakness for the economy going forward. In a sense, financial markets may be telling committee members at the Federal Reserve that they’re in danger of making an egregious policy error.
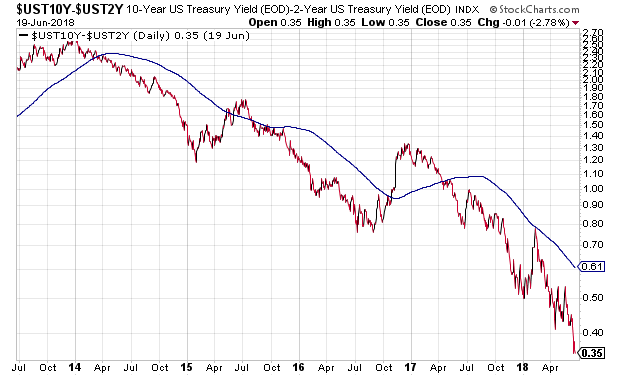
If one is predisposed to thinking that there is plenty of time to reduce risk asset exposure after yield curve inversion, he/she should bear in mind unique circumstances associated with yield curves then and now. In June of 1998, the Federal Reserve had largely been stimulating the economy with lower and lower rates; the Fed also cushioned from the potential damage associated with the Asian Currency Crisis (1998) and the collapse of Long Term Capital Management. Today, the Fed is tightening on two fronts – raising the overnight lending rate and reducing its balance sheet.
Meanwhile, stock prices may have been elevated in February of 2006, but they were not wildly overvalued. Real estate prices had bubbled up to insane heights. As the Treasury bond yield curve closes in on inversion here in 2018, however, many believe stock assets are illogically priced.
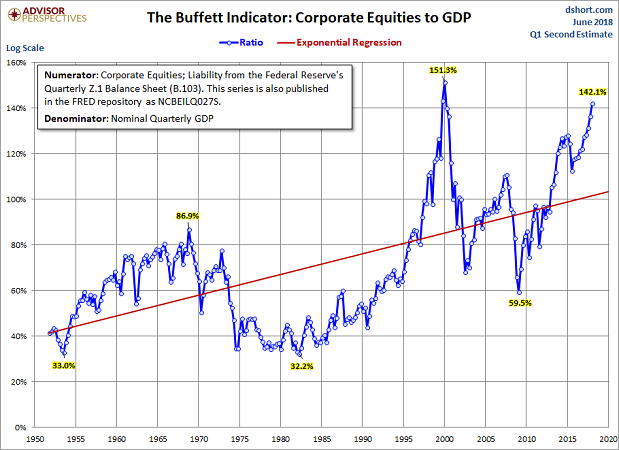
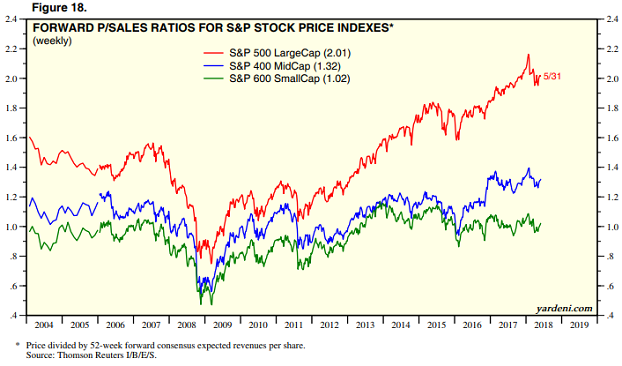
Granted, recession may not become a reality for 6-24 months after the Treasury bond yield curve inverts. The median is 11 months.
On the other side of the coin, forward looking stock markets may treat future yield curve inversion as a more potent harbinger than in previous cycles. Why? In essence, quantitative tightening (QT) will be climaxing at $50 billion per month.
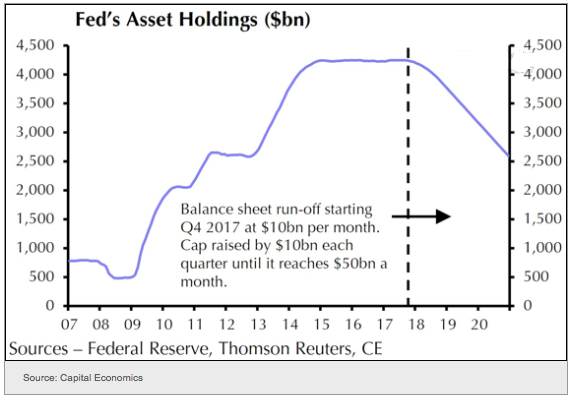
It is evident to most market watchers that global central bank intervention via ludicrously low rates and record debt expansion propelled risk assets to lofty heights. If the justification of ultra-low interest rates is to be believed, the rising cost of credit is likely to reverse the exuberance.
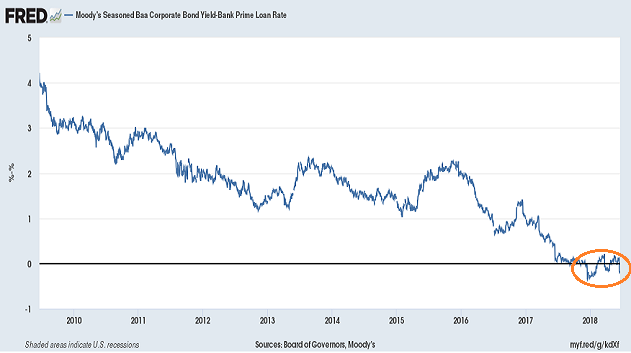
Yield curve inversion is already taking place outside of U.S. Treasuries. For example, in many instances, longer-term bonds around the globe offer less in yield than shorter maturities. Similarly, long-dated “seasoned” corporate bonds are yielding less than the prime lending rate.
Perhaps ironically, the broader stock market is responding to these signs already. The S&P 500 is still below its January 2018 highs, nearly five months later. In the same vein, stocks trading on the New York Stock Exchange (NYSE), in aggregate, remain range bound.
If one digs deeper, he/she sees that the Financial Select Sector SPDR (NYSE:XLF) is in the red for 2018. Why is this case? Flat curves and inverted curves make it extremely difficult for financial firms to generate profits organically, as opposed to one-time tax cut comparisons.
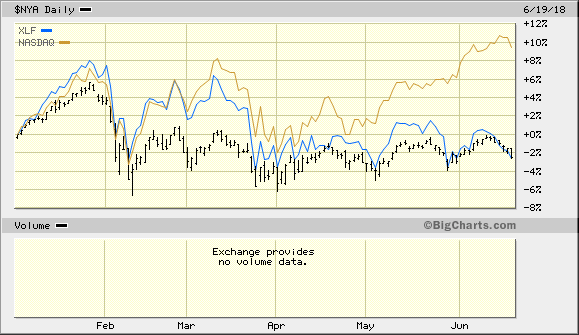
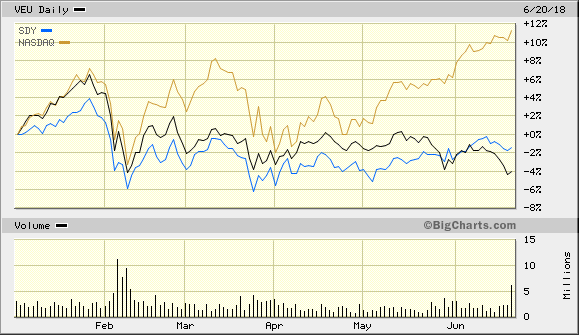
In contrast, the tech-oriented NASDAQ as well as growth oriented stocks in the mid-cap and small-cap space are carrying the entire burden. Neither the Dow Jones Industrials nor popular exchange-traded funds like Vanguard Value (NYSE:VTV) or Vanguard High Dividend Yield (NYSE:VYM) have been able to recover their January peaks.
The results are largely a function of higher “risk-free” Treasury bond yields competing with dividends. And in the bigger picture, yield curve flattening (leading to eventual inversion) may be holding other segments of the overall stock market back.
Should you attempt to shift your allocation away from value-oriented securities? Should you concentrate on the technology explosion at the root of stock market success? Should all of your eggs go into the “game-changing disruptor” basket?
The problem with doing so is that performance chasing is unlikely to end well. It certainly did not end well in the tech wreck (3/2000-10/2002).
If you are going to ride the wave, if you are going to avoid dividend-oriented securities as well as international funds like Vanguard FTSE All World ex US (NYSE:VEU), you need to have a plan in place for when the non-diversified approach falls apart. Diversification may or may not be a free lunch. Non-diversification at this stage may prove to be free risk without the reward.
Disclosure Statement: ETF Expert is a web log (“blog”) that makes the world of ETFs easier to understand. Gary Gordon, MS, CFP is the president of Pacific Park Financial, Inc., a Registered Investment Adviser with the SEC. Gary Gordon, Pacific Park Financial, Inc., and/or its clients may hold positions in the ETFs, mutual funds, and/or any investment asset mentioned above. The commentary does not constitute individualized investment advice. The opinions offered herein are not personalized recommendations to buy, sell or hold securities. At times, issuers of exchange-traded products compensate Pacific Park Financial, Inc. or its subsidiaries for advertising at the ETF Expert website. ETF Expert content is created independently of any advertising relationship.
