Public companies seldom distribute more to shareholders than what they earn in a given year. It is categorically uncommon for those corporations to pay out more in dividends and share buybacks than what they earn for two years in a row. Three years? That’s never happened.
Take a look at the total payout ratio dating back to 1964. The ratio (dividends + buybacks/corporate earnings) surpassed 100% for two consecutive years as the U.S. dealt with the early ’90s economic downturn and accompanying stock bear. Companies did it again during the turn-of-the-century “tech wreck” in stocks and collateral economic contraction. The payout ratio also exceeded 100% in 2007 and 2008 – a period when the housing bubble burst and the financial crisis gave rise to the Great Recession.
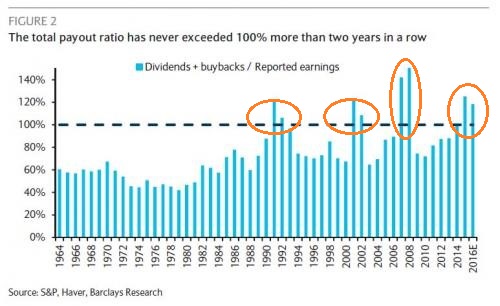
Now consider what transpired in 2015 and what will take place in 2016. Public companies will have paid out (i.e., dividends, buybacks) more than what they brought in via reported earnings for two straight years. It follows that one might anticipate a slowdown in both dividend growth as well as buyback totals going forward. And if that happens, stock prices could take a major hit.
Granted, we may not be talking about a death knell for equities. On the flip side, the pattern over the last 30 years is palpable. The Fed indirectly or directly lowers borrowing costs. Corporations ratchet up borrowing activity, allowing them to give more money to shareholders regardless of the business environment. The business environment eventually weakens. Inevitably, companies reign in their payouts to compensate for poor sales and unremarkable earnings. And stock prices fall.
Not sure about the historical pattern repeating itself? Consider the timing of the peaks in business debt via corporate-debt-to-GDP. The timing dovetails with payout ratios exceeding 100%. In other words, each time that businesses over-leveraged themselves in the past, stock market sell-offs and economic downswings occurred.
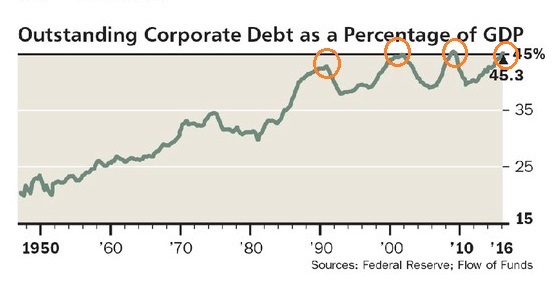
Make no mistake about corporate leverage either. The binge is evident in a wide range of measures – debt as a percentage of GDP, total cash on books versus debt outstanding, interest coverage, as well as debt-to-EBITDA.
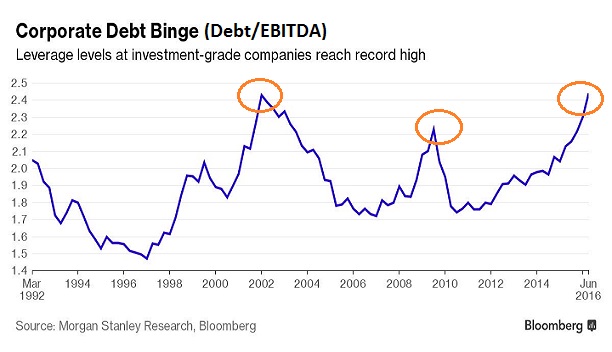
In the same way that payout ratios above 100% limit dividend growth and stock buybacks going forward, debt-to-EBITDA extremes as well as debt-to-GDP excesses restrain company capacity to add leverage in the future. Peak debt, like peak payouts, does not bode well for stocks.
Couldn’t earnings explode to the upside in spite of diminishing payouts and constraints on corporate leverage? Anything is possible, though it is unlikely to occur if the U.S. dollar continues to climb or if the global economy continues to struggle.
It is true that three out four S&P 500 corporations are currently beating analyst estimates. Yet don’t let the financial media fool you. According to Michael Lebowitz of 720 Global, since Q2 of 2012, earnings growth forecasts made a year in advance averaged 14.76%. What did actual earnings growth over the same time period turn out to be? 3.82%.
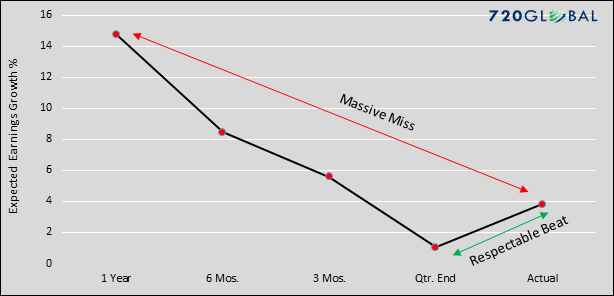
It gets worse. If we assume that analysts regularly drop estimates by at least 10 percentage points over the course of a year – if we recognize that the game is played so that 65%-75% of companies can “beat expectations” going into quarterly earnings announcements – then stocks would be deemed even more overvalued than they already are.
Specifically, Forward P/Es for the S&P 500 are currently based on reported earnings estimates of $118.79 (9/30/2017). Adjusted for the 10% estimate drop? $106.9. That places the Forward P/E for the S&P 500 at 20. Even if one uses non-GAAP operating earnings estimates of $127.59, and adjusts for the 10% estimate drop accordingly ($114.84), the Forward P/E is 18.6.
The 10-year average for the S&P 500’s Forward P/E is 14.3.
In truth, even if earnings grow anywhere near analyst estimates for the coming 12 months, a reversion to the mean for payouts as well as corporate leverage may weigh too heavily on stock prices. That’s a fancy way of suggesting that a downturn in the credit cycle is likely to coincide with a downtrend in stocks.
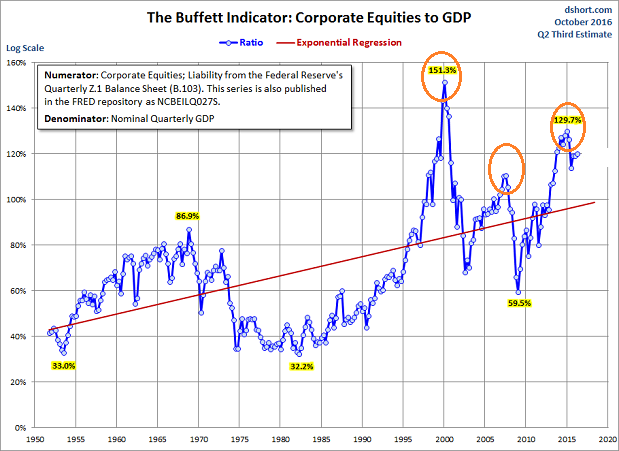
One last thing: Market capitalization-to-GDP has been highlighting the same peaks as corporate debt-to-EBITDA, corporate debt-to-GDP and the total payout ratio. Peaks in valuation indicators (e.g., market-cap-to-GDP, Forward P/E, etc.), leverage measures (e.g., corporate-debt-to-GDP, debt-to-EBITDA, etc.) and dividend sustainability (e.g., payout ratio, total payout ratio, etc.) may be signalling a bearish turn for equities in the months ahead.
Disclosure: Gary Gordon, MS, CFP is the president of Pacific Park Financial, Inc., a Registered Investment Adviser with the SEC. Gary Gordon, Pacific Park Financial, Inc, and/or its clients June hold positions in the ETFs, mutual funds, and/or any investment asset mentioned above. The commentary does not constitute individualized investment advice. The opinions offered herein are not personalized recommendations to buy, sell or hold securities. At times, issuers of exchange-traded products compensate Pacific Park Financial, Inc. or its subsidiaries for advertising at the ETF Expert web site. ETF Expert content is created independently of any advertising relationships.
