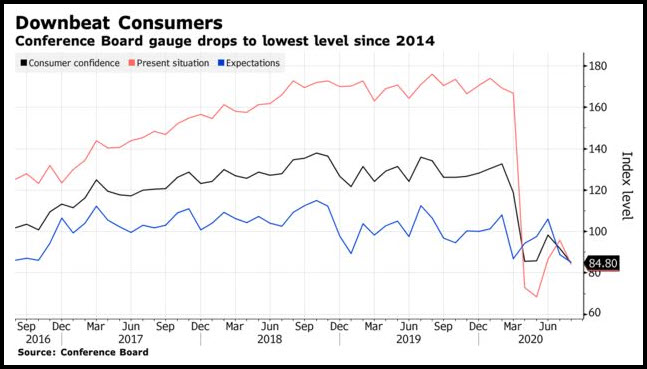
Today’s chart (below) is the consumer confidence survey data, which yesterday hit it’s lowest level since 2014.

At the same time, data on new home sales, and earnings from home builder Toll Brothers (NYSE:TOL), are at their best levels in years.
It seems a little inconsistent to have very low AND declining consumer confidence at the same time that there’s a housing boom.
What is not surprising is that stocks, of course, focused on the bullish data and rallied. This makes sense considering that housing, real estate, and their related impacts on consumption are often estimated to be responsible for over 10% of GDP.
There are two reasons to take note of yesterday's Consumer Confidence data, and even more importantly, next month’s data.
Low and declining confidence would logically indicate that the economic recovery is happening slower than expected, and this should be bearish for stocks. On a day that didn’t have conflicting bullish news, this data may have caused stocks to sell off.
Additionally, there is some bullish news here. Consumer confidence will come back. With it sitting at such a low level, its return will be big. And when the market sees big gains in consumer confidence, even from a low level, it will be bullish for stocks.
It may not be next month, but keep your eye out for these reports going forward.
Best wishes for your trading.
Key Levels
Note: PDL = Prior day low, PDH = Prior day high
S&P 500 SPY All-time high. 340 then 335 are important support.
Russell 2000 (IWM) Closed over PDH. Now sitting on 10 DMA. Key area to break is 157, then 160 is resistance area. Support at 155 then swing low is 153.60
Dow (DIA) New swing high then consolidation. Gap fills at 291. Support at 280.
NASDAQ (QQQ) Inside day. 275 is pivotal support area. 260 is key support level and a trendline.
TLT (iShares 20+ Year Treasuries) Gapped down into the middle of its range 167-163. In a Warning Phase.
