What will the S&P 500 bring next week? That is the subject of discussion in our next premium analysis due out late Sunday!
The last time we looked at the Japanese Nikkei 225 was on November 19th, 2019. The index was comfortably trading above 23 400 and the uptrend seemed very healthy, on the surface at least. And indeed, in December, the price reached 24 116.
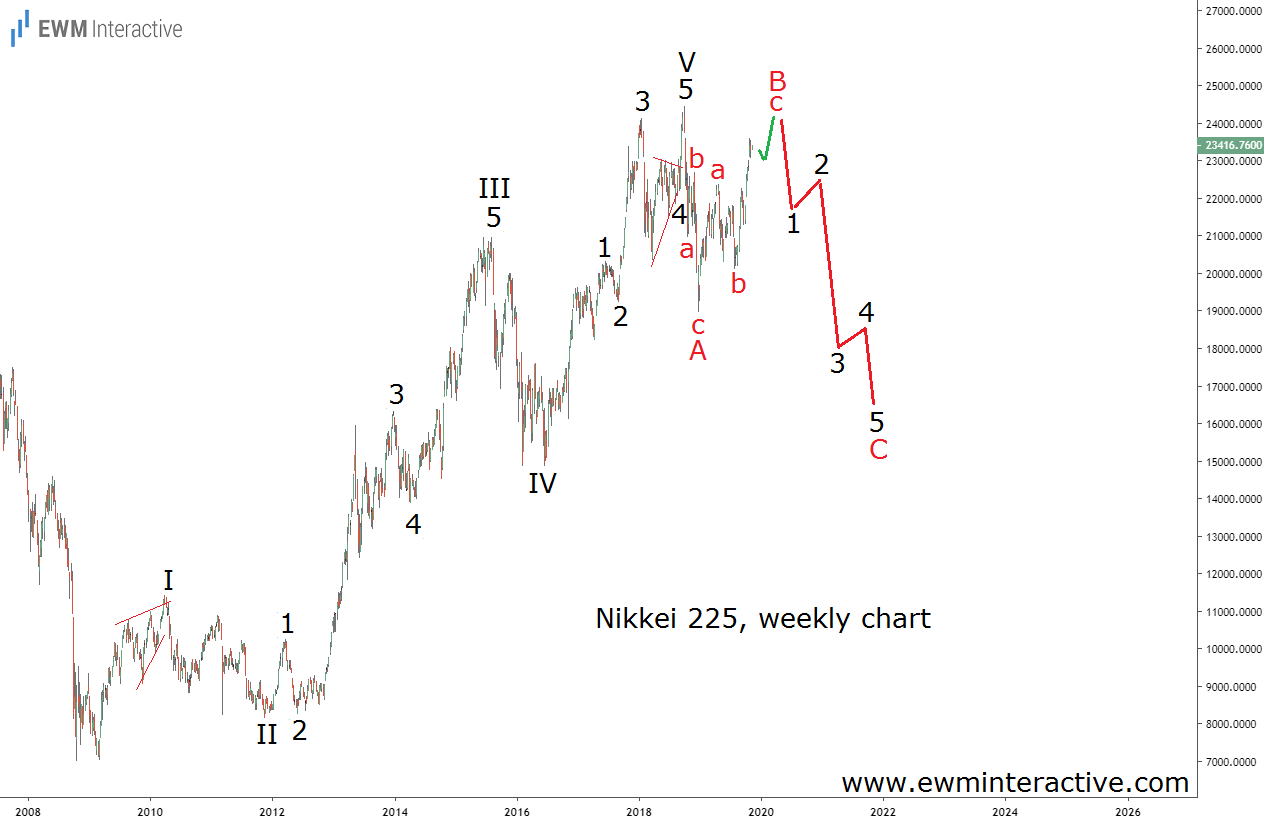
However, the fact that prices have been rising in the past didn’t mean they are guaranteed to keep rising in the future. With that in mind, we examined Nikkei’s weekly chart through the lens of Elliott Wave analysis. The chart below summarizes what we found four months ago.

It revealed that Nikkei’s recovery from under 7000 to nearly 24 450 was a five-wave impulse. We labeled the patter I-II-III-IV-V, where the sub-waves of III and V were also visible. Wave I was a leading diagonal.
Impulses, according to the theory, are followed by a three-wave correction of the same degree. And indeed, there was a sharp drop to 18 949 in December 2018. Sharp, but relatively small, which made us think the worst was yet to come.
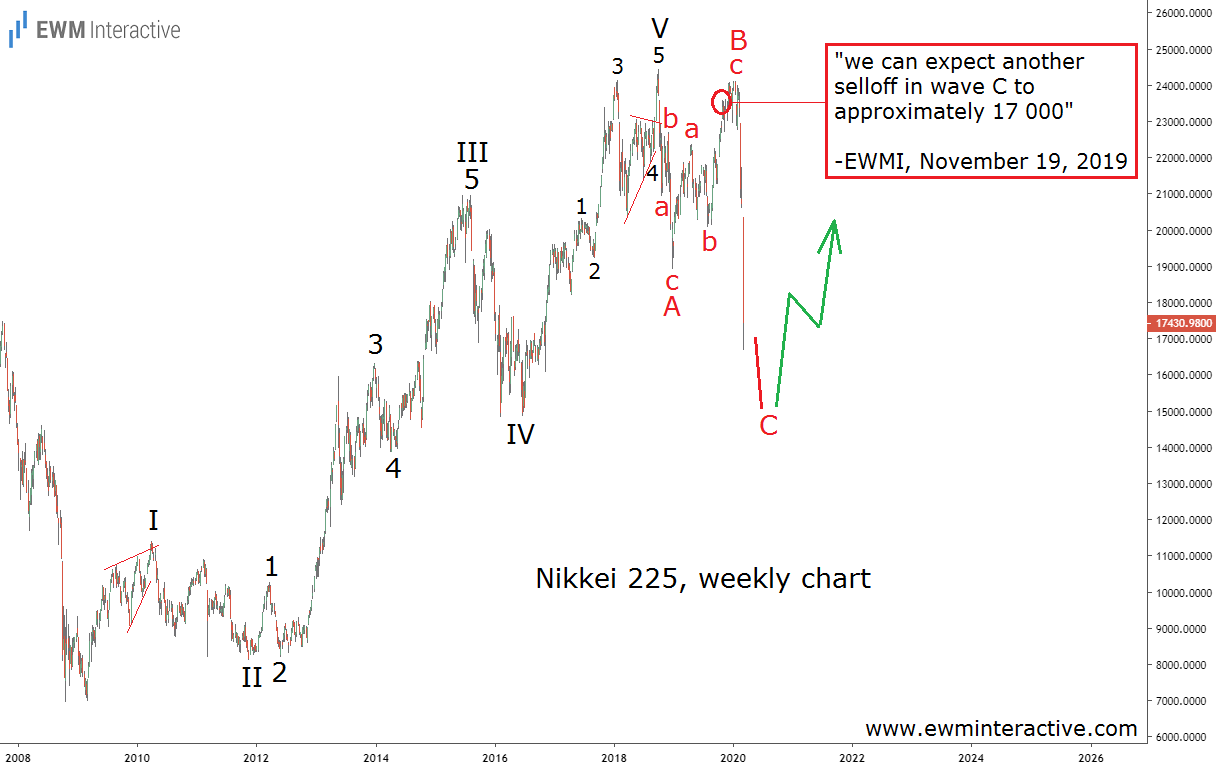
We thought an A-B-C flat correction was in progress. Four months ago, in November, its wave B was still unfolding. The resistance near 24 000 looked strong enough to cause a bearish reversal for the start of wave C. And since corrections usually erase most of wave V, it made sense to “expect another selloff in wave C to approximately 17 000.” Then this happened:

The bulls managed to keep the show going for a while, but in mid-January the bears officially returned. The start of the coronavirus pandemic was the trigger that pushed the Nikkei over the cliff. Two months and over 30% to the south later, Nikkei 225 touched 16 690.
It turns out the Elliott Wave principle put investors months in advance of a true black swan event. The way the market anticipated a totally unpredictable virus outbreak is puzzling but fascinating. And right now, it seems to be anticipating an upcoming recovery out of nowhere, too.
There is still room for a drop to the termination area of wave IV near 15 000. Once wave C is over, a bullish reversal can be expected. The following rally should be able to conquer 25 000 and beyond.
