NVDA Q3 Earnings Alert: Why our AI stock picker is still holding Nvidia stockRead More

Nifty 50 Index Can Severely Injure The Bulls In 2021

Published 12/10/2020, 06:57 AM
Updated 07/09/2023, 06:31 AM
US500
-
SPY
-
NSEI
-

The U.S. S&P 500 index is up 67.6% since its March low. The Indian Nifty 50 did even better than that. The benchmark index of the second most populous country has climbed 79.4% from its 7511 bottom nine months ago. It currently trades slightly below 13 500, not far from its recent all-time high of 13 549.

While the COVID-19 crisis, despite the newly developed vaccines, is far from over, optimism abounds in stock markets worldwide. We, however, have never been fond of buying at new record highs. Instead of joining the bulls near 13 500, let’s first see where in the big Elliott Wave picture does the current surge fit.
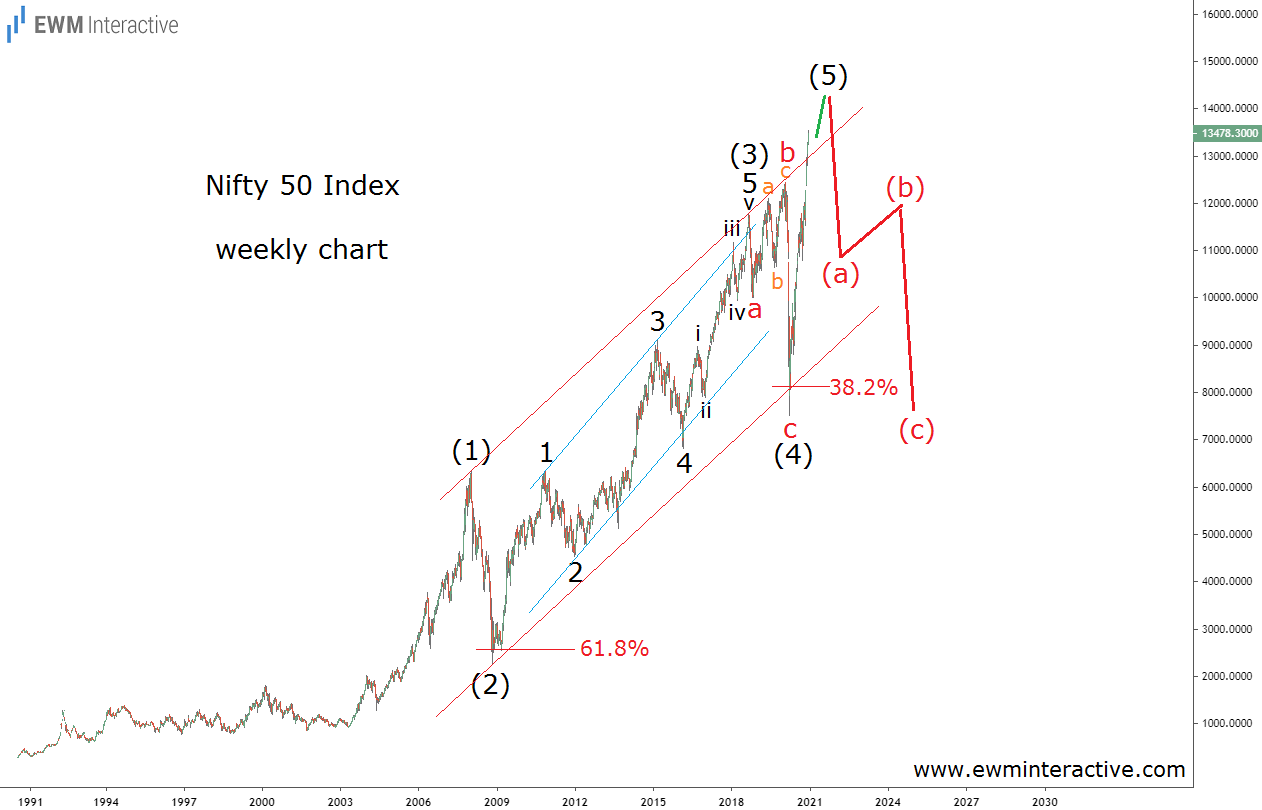
Nifty-50 Index Weekly Chart

The weekly chart above reveals the entire price history of the Nifty 50 since its inception. What should worry the bulls is that its structure can easily be seen as a five-wave impulse. Labeled (1)-(2)-(3)-(4)-(5), the pattern has been developing within the parallel lines of a trend channel.

Wave (2) occurred during the Financial crisis of 2007-2009. Wave (3), which is also enveloped in a nicely-looking price channel, was followed by an expanding flat correction in wave (4). The coronavirus crash fits in the position of wave ‘c’ of (4).

Nifty 50 to Begin 2021 at Its Worst Risk/Reward Ratio Ever

Both corrective waves – (2) and (4) – ended shortly after touching the 61.8% and 38.2% Fibonacci levels, respectively. If the analysis so far is correct, the phenomenal rebound we’ve been witnessing over the past nine months must be wave (5).

Unfortunately for the bulls, the theory states that a three-wave correction follows every impulse. This means that once wave (5) is over, we can expect a major decline to drag the Nifty 50 back to the support of wave (4). Where exactly the top will form is impossible to tell.

However, assuming a reversal near 14 500 and bearish targets near 7500, we are talking about a possible 45%-50% drop. Given that its P/E ratio currently stands at an all-time high of over 37, it is not that hard to image the Nifty 50 being cut in half. As we head into 2021, the Indian benchmark has never looked riskier for investors.

Original Post

Latest comments

Loading next article…
Risk Disclosure: Trading in financial instruments and/or cryptocurrencies involves high risks including the risk of losing some, or all, of your investment amount, and may not be suitable for all investors. Prices of cryptocurrencies are extremely volatile and may be affected by external factors such as financial, regulatory or political events. Trading on margin increases the financial risks.
Before deciding to trade in financial instrument or cryptocurrencies you should be fully informed of the risks and costs associated with trading the financial markets, carefully consider your investment objectives, level of experience, and risk appetite, and seek professional advice where needed.
Fusion Media would like to remind you that the data contained in this website is not necessarily real-time nor accurate. The data and prices on the website are not necessarily provided by any market or exchange, but may be provided by market makers, and so prices may not be accurate and may differ from the actual price at any given market, meaning prices are indicative and not appropriate for trading purposes. Fusion Media and any provider of the data contained in this website will not accept liability for any loss or damage as a result of your trading, or your reliance on the information contained within this website.
It is prohibited to use, store, reproduce, display, modify, transmit or distribute the data contained in this website without the explicit prior written permission of Fusion Media and/or the data provider. All intellectual property rights are reserved by the providers and/or the exchange providing the data contained in this website.
Fusion Media may be compensated by the advertisers that appear on the website, based on your interaction with the advertisements or advertisers.
© 2007-2024 - Fusion Media Limited. All Rights Reserved.