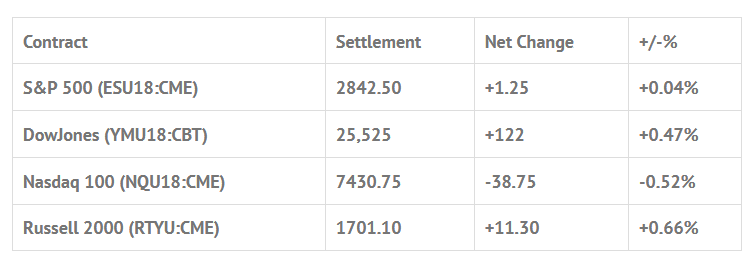
Index Futures Net Changes and Settlements:

Foreign Markets, Fair Value and Volume:
- In Asia 8 out of 11 markets closed higher: Shanghai Comp -0.30%, Hang Seng +0.08%, Nikkei +0.56%
- In Europe 12 out of 13 markets are trading higher: CAC +0.36%, DAX +0.48%, FTSE +0.42%
- Fair Value: S&P +0.38, NASDAQ +10.22, Dow -24.32
- Total Volume: 1.03mil ESU & 391 SPU traded in the pit
Today’s Economic Calendar:
Today’s economic calendar includes GDP 8:30 AM ET, Consumer Sentiment 10:00 AM ET, and the Baker-Hughes Rig Count 1:00 PM ET.
S&P 500 Futures: Big Choppy Mess

Yesterday, most of the Asian and European major indices traded lower overnight, as did the S&P 500 futures. After trading up to 2849.75 before Facebook’s stock plunge after second-quarter sales missed forecasts, the ES sold off down to 2833.25 on Globex Wednesday night and opened at 2837.25, down -4 handles. The S&P 500 futures initially dropped down to an early low at 2835.25, and then rallied up to 2843.75 before trading in a 4 to 5 handle trading range for the next hour and forty five minutes. From there, the ES made a high at 2844.75, pulled back down to 2840.00, and rallied up to 2846.50 just after 11:00.
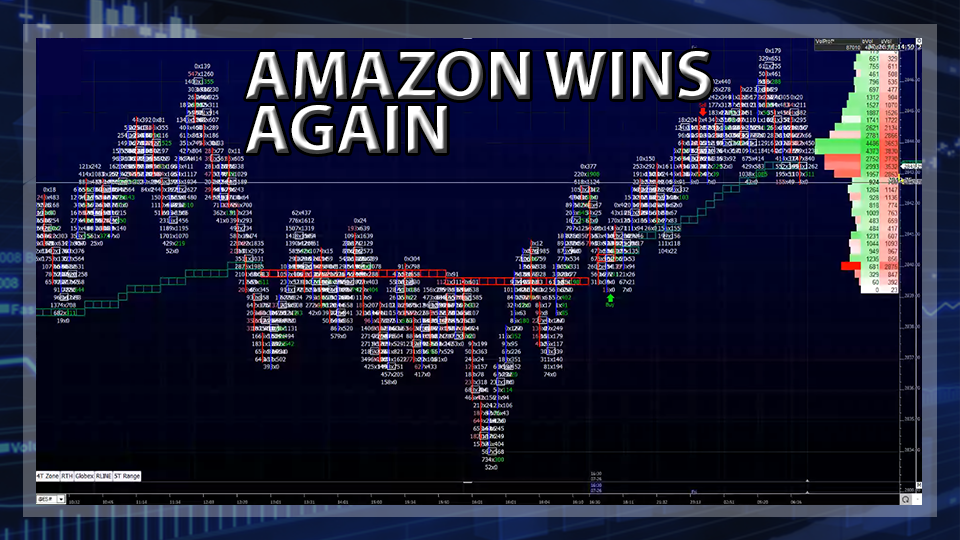
The next move saw the S&P’s sell off down to 2836.75 over the next hour, then rally up to 2841.75 at 12:30 before going sideways until the final hour when the futures started to sell off again as the MiM was growing to $450 million to sell. The ES had two more pullbacks down to 2837.75 and 2826.25, including two lower highs at 2841.50 and 2840.25, and then sold back off down to 2836.50 as the MiM went to over $1 billion to sell. On the 2:45 cash imbalance reveal the ES traded 2638.25, traded 2837.50 on the 3:00 cash close, traded down to 2833.50 after Amazon (NASDAQ:AMZN) reported earnings, then shot up to 2943.25 and settled at 2842.25 on the 3:15 futures close, down -3 handles, or -0.11% on the day.
In the end it was a gigantic day of choppy trade. Break, rally, break rally all day long. In terms of the days overall tone, the Dow held together well, and the ES was firm but sloppy. In terms of the days overall trade, only 1 million ES contracts traded.
August Outlook: Hot Julys Often Bring Late-Summer/Autumn Buys
From Stock Traders Almanac:
Psychological: Unwavering. July strength helped sustain bullish investor sentiment. According to Investor’s Intelligence Advisors Sentiment survey bulls are at 54.9%. Correction advisors are up modestly to 26.5% and Bearish advisors are just 18.6%. Thus far Q2 earnings season has supported the bulls with the vast majority of companies reporting better than expected numbers. As long as the trend of better-than-expected reports continues, the market is likely to continue to climb the wall of worry.
Fundamental: Firm. U.S. unemployment ticked higher to 4.0% earlier this month, but remains solid. Atlanta Fed GDPNow model is currently forecasting Q2 growth of 3.8%. Tariffs and U.S. dollar strength could have an impact on corporate earnings, but it will likely be limited as China will support its exporters by weakening the yuan and other stimulus efforts.
Technical: Conflicted. NASDAQ traded at new all-time highs earlier this month, but DJIA and S&P 500 are still lagging. DJIA’s chart is the weakest as the gap between its 50- and 200-day moving averages continues to shrink while DJIA is currently just above its 50-day moving average. Even Russell 2000 is beginning to show signs of weakness as it failed to trade at new highs this month. The divergences between the major indexes are still not a bullish indicator.
Monetary: 1.75-2.00%. The Fed’s next meeting will end on August 1 and the current probability of a rate increase at this meeting is just 2.5% according to CME Group’s FedWatch Tool as of July 26. The Fed has raised rates seven times thus far and they are shrinking their balance sheet. This combination of monetary policy tightening is beginning to raise concerns that they may go too far. Already there have been calls for a pause in rate increases. The Fed could be the market’s and the economy’s worst enemy if they tighten too quickly or too much.
Seasonal: Bearish. August is the worst month of the year since 1988. Average losses over the last 30 years range from 0.3% by NASDAQ to 1.2% by DJIA. In midterm years since 1950, Augusts’ rankings improve slightly: #8 DJIA, #9 S&P 500, #11 NASDAQ (since 1974), #7 Russell 1000 and #11 Russell 2000 (since 1982). Average losses range from 0.1% for Russell 1000 to 1.9% for Russell 2000. DJIA suffered double-digit losses in 1974, 1990 and 1998.
Geopolitical concerns over the past few months from snafus and issues at the U.S. southern border over immigration disputes to tough tariff talk and trade war concerns have been shrugged off by the market since the end of June. Positive Q2 earnings, rising GDP growth, sustained unemployment and low rates continue to please the market, sending the market higher in July. This put DJIA up 4.00%, S&P 500 up 3.75% and NASDAQ up 4.40% for the month of July so far, qualifying this as a “Hot July Market”.
Gains of this magnitude for July, however, have frequently been followed by a late-summer or autumn selloffs and better buying opportunities than now. In the past, full-month July gains in excess of 3.5% for DJIA have been followed historically by declines of 6.8% on average in the Dow with a low at some point in the last 5 months of the year. 
Disclaimer: Trading Futures, Options on Futures, and retail off-exchange foreign currency transactions involves substantial risk of loss and is not suitable for all investors. You should carefully consider whether trading is suitable for you in light of your circumstances, knowledge, and financial resources. Any decision to purchase or sell as a result of the opinions expressed in the forum will be the full responsibility of the person(s) authorizing such transaction(s). BE ADVISED TO ALWAYS USE PROTECTIVE STOP LOSSES AND ALLOW FOR SLIPPAGE TO MANAGE YOUR TRADE(S) AS AN INVESTOR COULD LOSE ALL OR MORE THAN THEIR INITIAL INVESTMENT. PAST PERFORMANCE IS NOT INDICATIVE OF FUTURE RESULTS.
