Major EU indices traded unchanged or lower yesterday amid fresh lockdowns across the continent. Risk appetite deteriorated further in the US and Asia, perhaps due to US Treasury Secretary Yellen defending plans for further tax increases. With that in mind, fears of a slower economic recovery in Europe, and concerns over tax increases in the US, may keep risk appetite subdued for longer than we have previously assumed.
US Dollar Gains, Risk Assets Slide On Risk-Off Trading
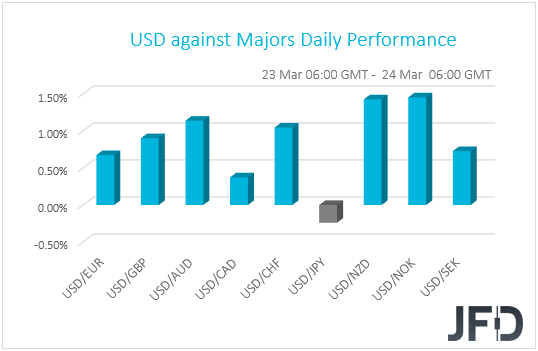
The US dollar traded higher against all but one of the other G10 currencies on Tuesday and during the Asian session Wednesday. It gained the most versus NOK, NZD, AUD, and CHF in that order, while it lost some ground only against JPY.
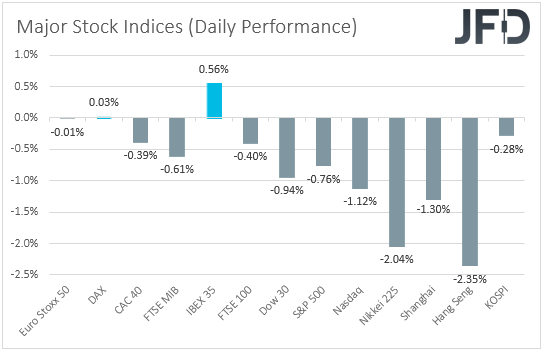
The strengthening of the US dollar and the Japanese yen, combined with the weakening of the risk-linked Aussie and Kiwi, suggests that markets traded in a risk-off fashion yesterday and today in Asia. Indeed, turning our gaze to the equity world, we see that major EU indices closed unchanged or lower, with the only exception being Spain’s IBEX 35, which gained 0.56%. Market sentiment deteriorated even further during the US and Asian sessions, with the main losers being Hong Kong’s Hang Seng and Japan’s Nikkei 225.
European stocks eased yesterday amid fresh lockdowns across the continent. In Germany, Chancellor Angela Merkel decided to extend the existing restrictions until Apr. 18, while in France, new infections accelerated despite the start of a third lockdown.
Austria postponed the reopening of café and restaurants. Later, in the US, sentiment was hurt further, following the testimony of Fed Chair Jerome Powell and US Treasury Secretary Janet Yellen before the House Financial Services Committee. Yes, Powell reiterated his view that any spike in inflation in the months to come is likely to prove to be temporary, and Yellen repeated her optimism over the economic recovery.
However, Yellen added that the US economy remains in crisis and defended developing plans for further tax increases, in order to finance the new public investments. The two officials testify today before the Senate Banking Committee, but we don’t expect to hear anything different.
With all that in mind, fears of a slower economic recovery in Europe, and concerns over tax increases in the US, may keep risk appetite subdued for longer than we have previously assumed. Equities, oil prices, and other risk-linked assets, are likely to stay under selling interest for a while more, while the US dollar may continue to strengthen.
That said, we still believe that this is a corrective phase. With most major central banks pledged to keep their respective monetary policies extra loose, and projecting that any inflation spikes in the months to come are likely to prove to be temporary, we do see the case for the prevailing uptrends in equities to resume in the foreseeable future.
Hang Seng Technical Outlook
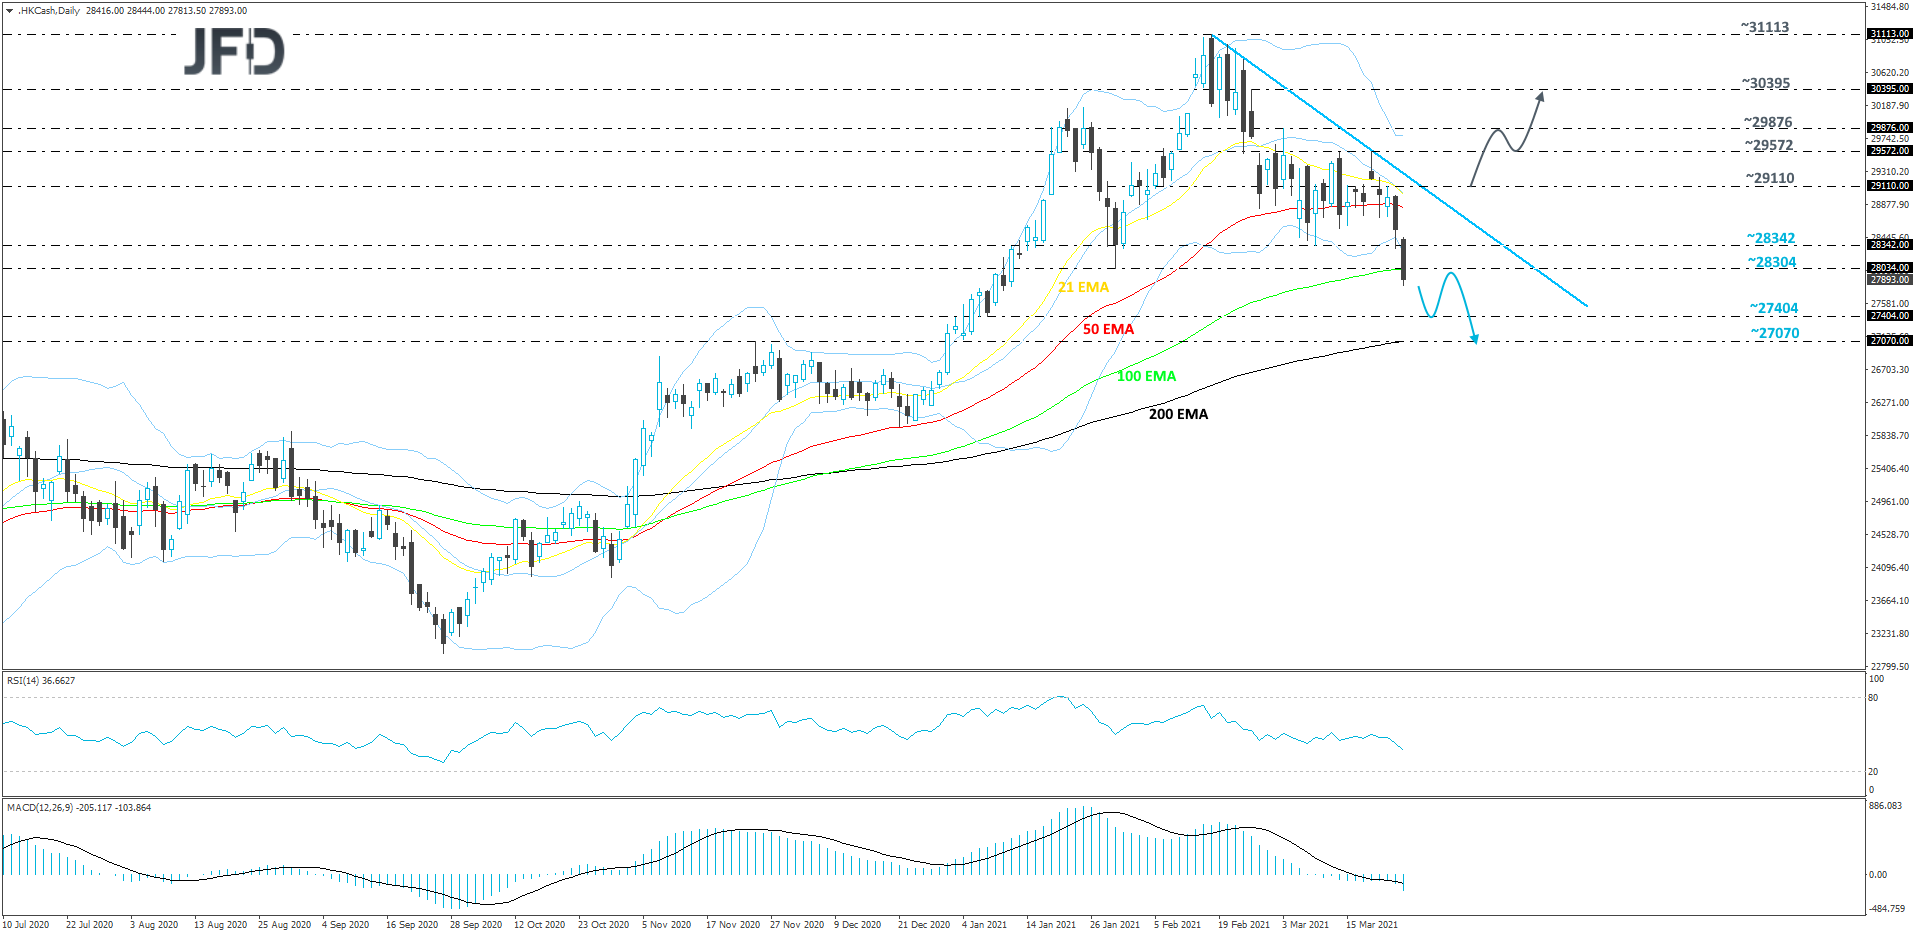
The technical picture of the Hang Seng index on our daily chart shows that after peaking in mid-February, the price is now slowly drifting lower, while trading below a short-term tentative downside resistance line taken from the high of Feb. 18. Today, the index moved further south, overcoming some key support areas, at 28342 and 28034, marked by the lows of Mar. 9 and Jan. 29 respectively.
At the same time, the price fell below the 100-day EMA, and if it continues to trade below it, there is a decent chance to see some lower levels being hit. For now, we will take a bearish approach.
Hang Seng could move lower and test the 27404 hurdle, marked by the high of Dec. 31 and the low of Jan. 7. The index might rebound from that area, but if it remains below the 100-day EMA, this may invite the bears back into the game again. If this time the sellers are able to overcome the 27404 obstacle, this could open the way towards the 27070 level, marked by the highest point of November and the lowest point of January.
Alternatively, if the index reverses to the upside, breaks the aforementioned downside line and climbs above the 29110 barrier, marked by the high of Mar. 22, that might spook the bears from the field, potentially attracting more buyers. Hang Seng could rise to the 29572 obstacle, or to the 29876 hurdle, marked by the highest point of March. If the buying doesn’t stop there, the next possible target may be at 30395, which is the high of Feb. 25.
USD/CHF Technical Outlook
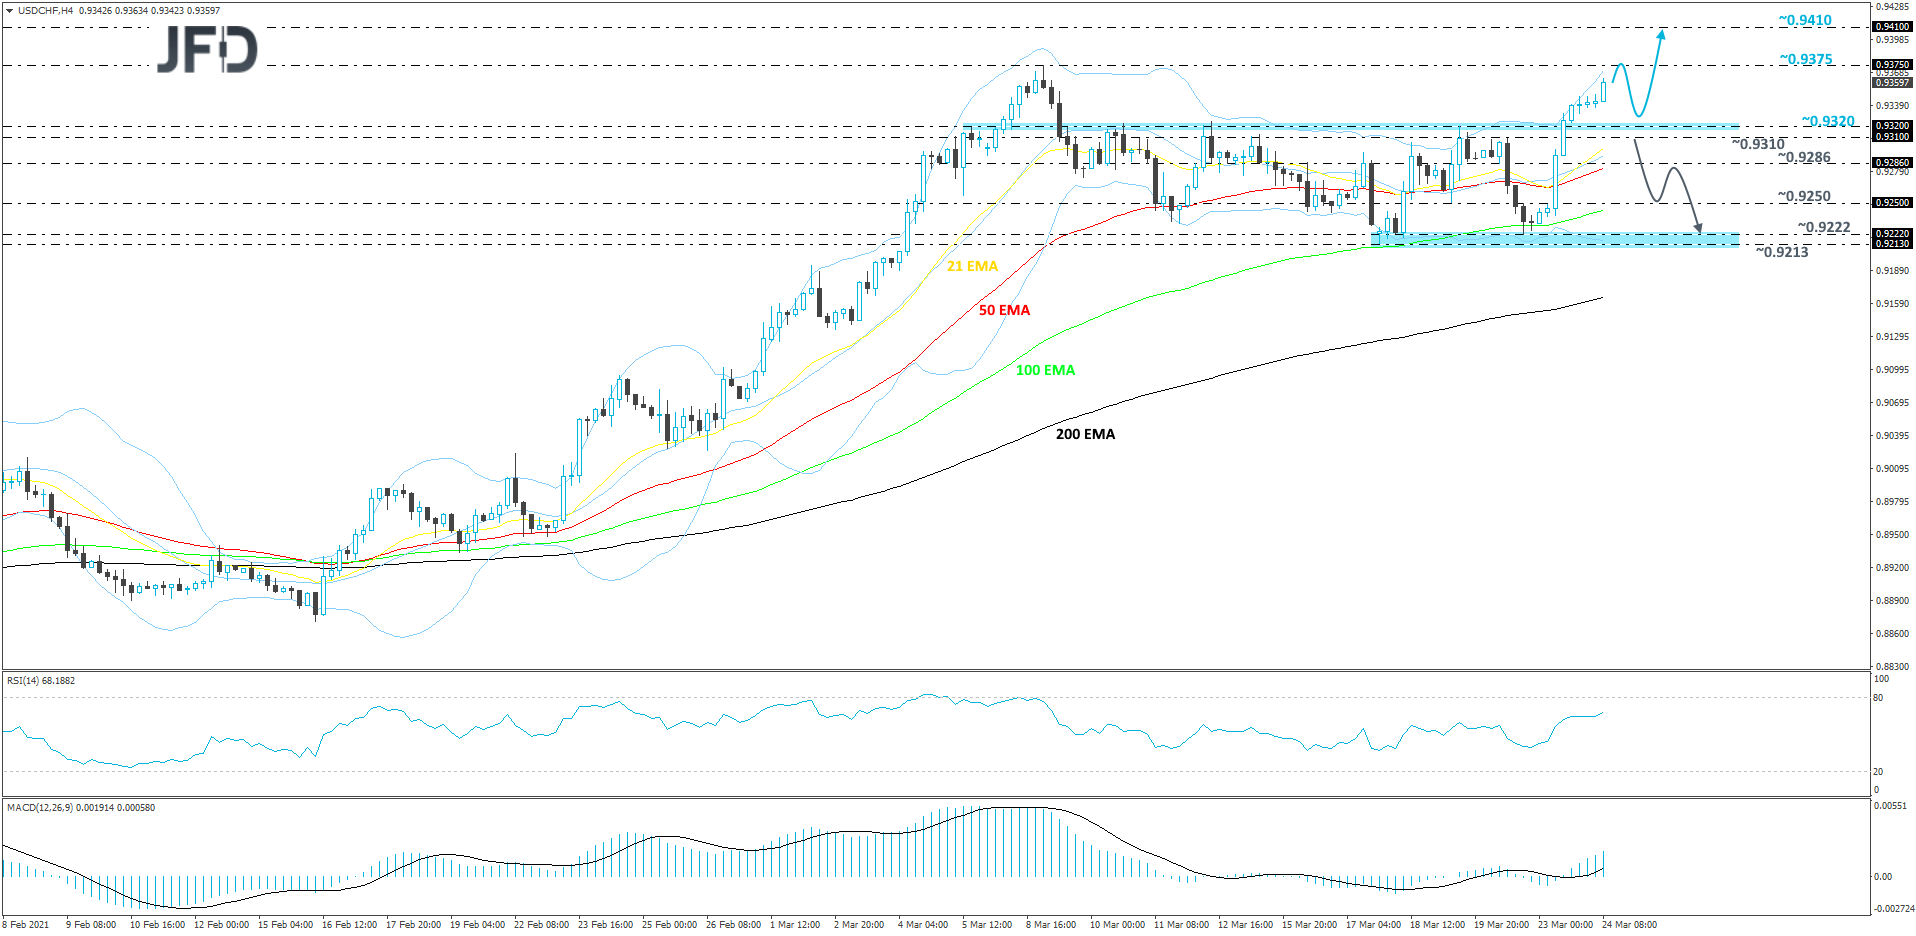
Yesterday, USD/CHF broke through one of its key resistance barriers, at 0.9320, which is marked near the highs of Mar. 5, 10, 12 and 19. Now the pair is showing willingness to move further north, as it continues to balance above that broken resistance barrier, which now might turn into strong support. We will take a bullish approach for now.
A further push north may bring the rate closer to the current highest point of March, at 0.9375. USD/CHF could stall there for a bit, or even correct back down. That said, if the previously discussed hurdle, at 0.9320, acts as a strong support area, the bulls might take charge again and lift the pair higher. If this time the buyers are able to overcome the 0.9375 obstacle, this will confirm a forthcoming higher high, possibly leading the rate to the 0.9407 level, marked by the high of July 20, 2020.
On the other hand, if the rate falls back below the aforementioned 0.9320 hurdle and also slides below the 0.9310 zone, marked by the high of Mar. 22, that may spook the bulls from the field temporarily, as such a move might increase the pair’s chances of sliding further. USD/CHF could then travel to the 0.9286 obstacle, or to the 0.9250 area, marked by the ow of Mar. 19 and by an intraday swing high of Mar. 23. If the 0.9250 obstacle doesn’t stop the fall, the pair might easily fall to the 0.9222 hurdle, marked by the current low of this week, or to the 0.9213 level, which is the low of last week.
As For The Rest Of Today's Events
During the early European morning, we already got the UK CPIs for February. The headline rate fell to +0.4% yoy from +0.7%, instead of rising to +0.8% as the forecast suggested, while the core rate slid to +0.9% yoy from +1.4% yoy, with the forecast being for an unchanged print.
We also have the preliminary PMIs from several European nations, the Eurozone as a whole, the UK and the US. In Eurozone, the manufacturing index is forecast to have risen to 58.1 from 57.9, while the services one is expected to have inched up to 46.0 from 45.7.
This is likely to take the composite index up to 49.1 from 48.8. Although an improvement, this still points to contraction, which combined with a chaotic vaccine rollout and the new lockdowns across the bloc, is unlikely to result in enough optimism to boost European equities and the common currency.
No forecasts are available for the UK prints, while in the US, both the manufacturing and services PMIs are anticipated to have risen to 59.4 and 60.2, from 58.6 and 59.8 respectively. This will confirm that the economic recovery in the US continues at a fast pace, but the question is whether it will revive inflation fears.
Apart from Powell and Yellen, we also have two more speakers on today’s agenda and those are New York Fed President John Williams and San Francisco Fed President Mary Daly.
