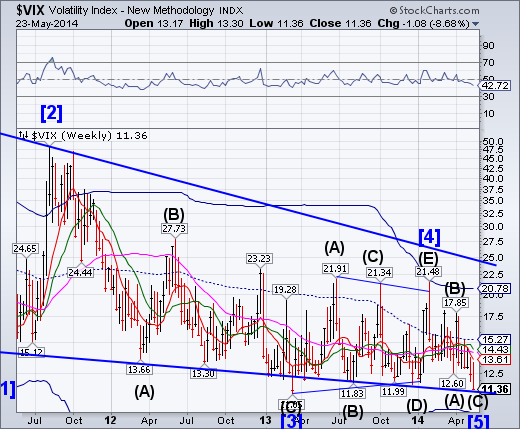
VIX made a 14-month low on Friday and challenging its March 15, 2013 low at 11.05.It may go lower to challenge its December 2006 low at 9.39.The new word is VIX termination, used to describe the selling of VIX into the close each day. It will work until it doesn’t.
SPX made a new all-time closing high
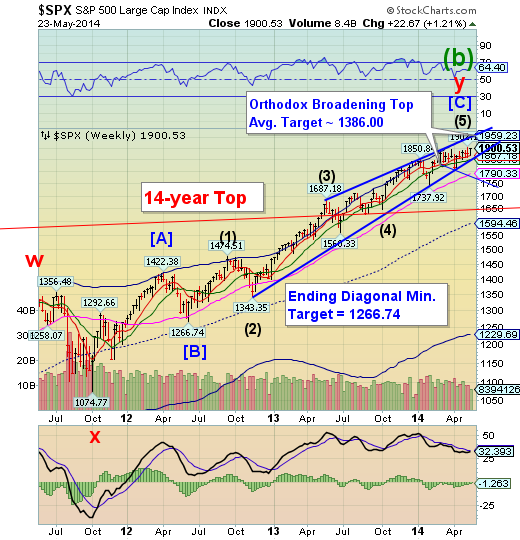
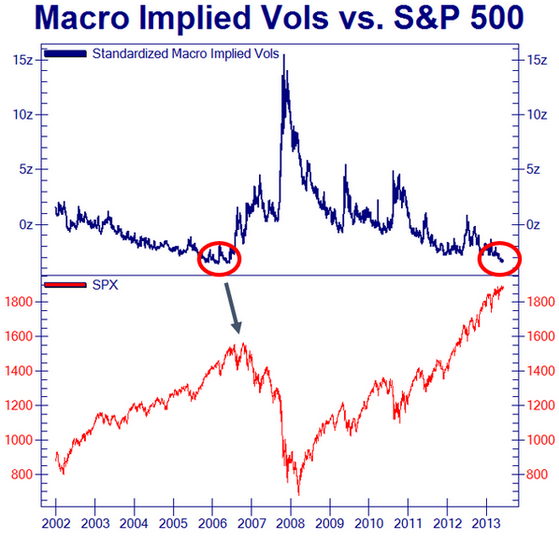
The SPX made a new closing high, but did not exceed its intra-day high on May 13.A reversal may be made by simply declining beneath its Ending Diagonal trendline and weekly Short-term support at 1867.18.The combination of all-time highs and extreme VIX lows may be a ticking time bomb.
NDX extends its Right Shoulder
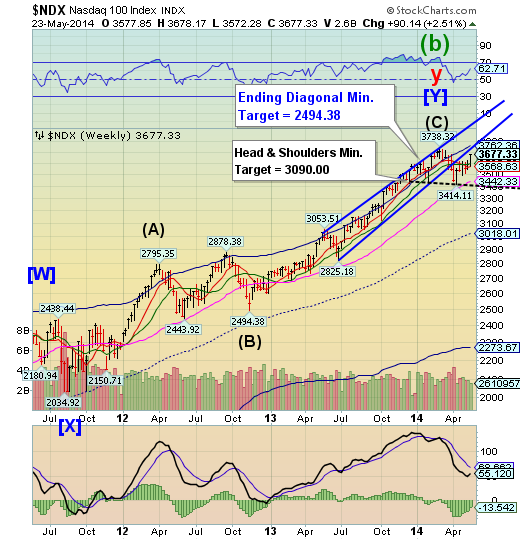
NDX extended the right shoulder of its Head & Shoulders formation.It is temporarily above its weekly support/resistance lines, but the Cycles Model calls for a turn no later than Tuesday.Once below the support area, it may test the Head & Shoulders neckline at 3410.00.
ZeroHedge: Moving along to today’s story, we find that the retail investor is getting back into the stock market and is seemingly focused on the riskiest types of shares; unlisted penny stocks. They aren’t just dipping their toes in either. The pace exceeds that of the tech boom of the late 1990′s and has just hit the highest amount on record.
ZeroHedge: Following up on the initial report last September, we found that the "most shorted stocks" had soared relative to the S&P 500, and while an outright basket long consisting of the most-shorted names would have outperformed the market massively, even a pair trade in which one was long the most shorted names and short the S&P 500 would have outperformed 99% of all hedge funds.
The Euro declined to Long-term Support
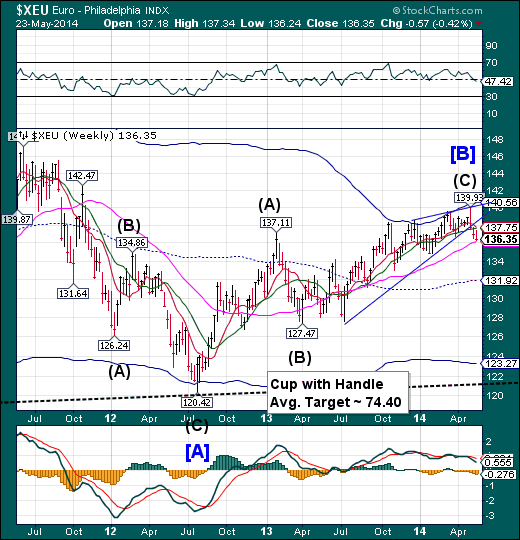
The euro declined this week to challenge weekly Long-term support at 136.14. It is likely to bounce back to Intermediate-term resistance next week before resuming its decline.EndingDiagonals are usually fully retraced, so we may expect a minimal decline to 127.47, with a high probability of testing its weekly Cycle Bottom at 123.27.
Reuters: The euro fell to a three-month low against the dollar and a 17-month trough against the pound on Friday after a disappointing report on German business sentiment supported the view the European Central Bank will cut interest rates next month.
Concerns that Sunday's European Union election results could destabilize some euro zone governments also weighed on the euro.
Germany's leading indicator of business confidence, the Ifo index, pointed to slower growth in Europe's largest economy as the index hit its lowest level this year in May.
EuroStoxx continues to struggle near the highs
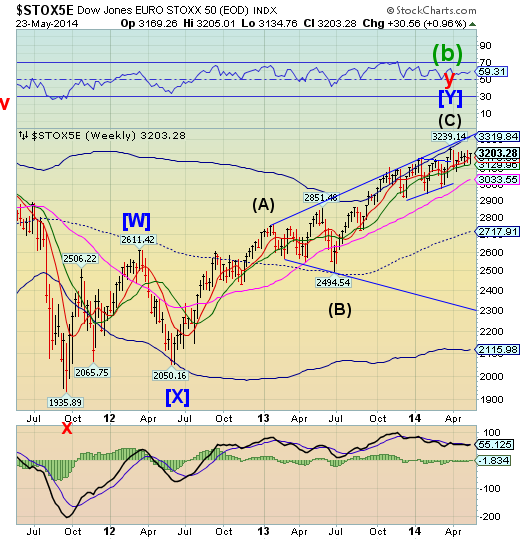
The EURO STOXX 50 (FSTX) 50 index continues to struggle on waning momentum.Friday’s rally appears to be a Fibonacci 78.6% retracement that may have peaked near the close.Could this be the failure that finally breaks supports next week?
ZeroHedge: 40% of European firms say the severity of late-payment problems were preventing them from hiring as "even when the public sector pays promptly, the money doesn't sloosh down the system promptly because of the culture of late payment." As the FT reports, small and medium-sized enterprises are the hardest hit by late-payment consequences with nearly three-quarters saying nothing has changed in the last few months and in fact nearly half saying the problem is getting worse. "The late payment consequences for businesses pose a real threat to Europe’s competitiveness and social well-being," warns one analyst, as "companies are deliberately not sticking to the provisions of the EU directive as a way of managing their cash flow." The reason - of course - the unintended consequences of policy-makers centrally planned efforts to ensure nothing bad ever befalls an important firm/nation ever again - "It's a way of borrowing off smaller companies – and they should be held to account."
The Yen tests Long-term resistance
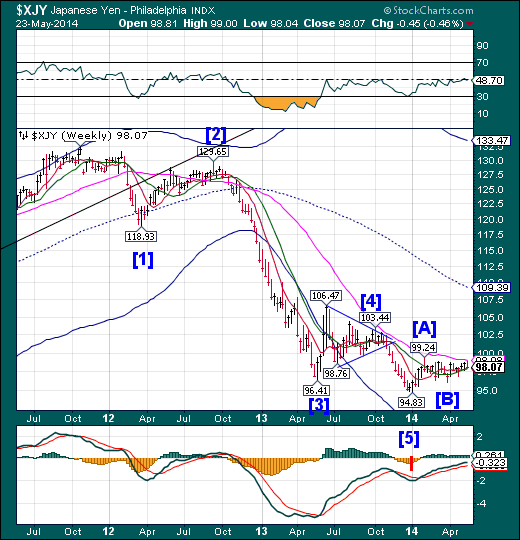
The yen closed above its Model supports after challenging Long-term resistance at 98.98. This may resolve the three-month-long sideways consolidation, which is a coiling action that often results in a continuation of the move preceding it. Should traders start to view the Yen as a safe haven during political and economic turmoil, the money flow may reverse course and move from stocks to currencies such as the Yen.
ZeroHedge: Kuroda is telling investors not to buy JPY just because the BoJ is being very reticent on policy ease. This week’s Nikkei dip below 14000 and JPY below 101 were likely viewed a s very negative developments, given the headwinds that the sales tax increase will generate. Hence the strong effort here to draw a line under the JPY, and delink it from monetary policy.
The Nikkei bounces a third time from its Head & Shoulders neckline
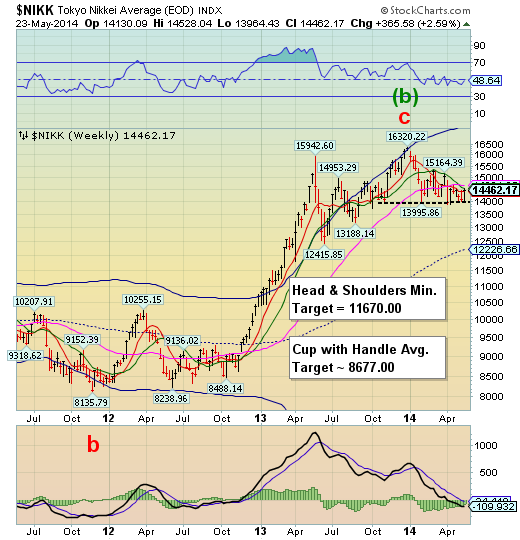
The Nikkei bounced the neckline of its Head & Shoulders formation at 14000.00for a third timethis week.Currently it is challenging weekly Intermediate-term resistance at14535.52. A breakout in the Yen may accompany the Nikkei losing neckline support. The longevity of the right shoulder introduces the Cup with Handle formation that is not exclusive of the other formation.
Reuters: Japan's Nikkei share averagesurged to a four-week high on Friday morning, thanks to upbeateconomic data in Japan's two biggest trade partners, with theyen's retreat rounding out an encouraging array of positivecatalysts.
The Nikkei share average rose 1.0 percent to14,475.90, pulling further away from a one-month low of 13,964hit on Wednesday and briefly tapping levels not seen since April 25.
The market took off on the tailwind of surveys showingChina's factory sector had its best performance in five monthsin May and U.S. factory output growth hitting its fastest pace
since February 2011..
U.S. Dollar rises above the Wedge trendline
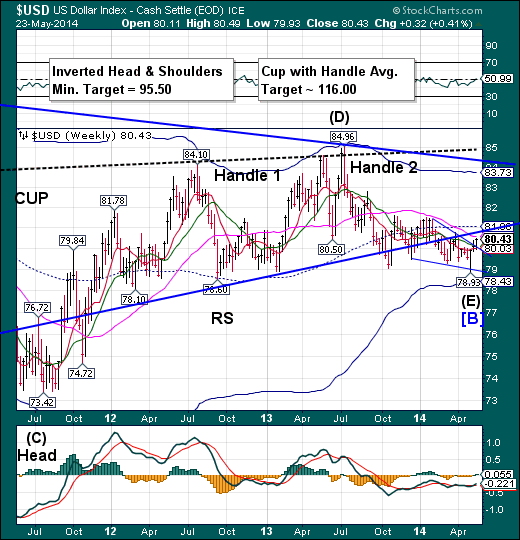
The US Dollar Index rose above Intermediate-term support/resistance at 80.03 and its Wedge trendline at the close of the week. A breakout above Long-term resistance at 80.43 and the Triangle trendline may be noteworthy to traders. A breakout above, mid-Cycle resistance at 81.08 cyclically confirms a probable new uptrend.
MarketWatch: The dollar rose Friday, notching weekly gains against the euro, yen and Australian dollar.
Sales of new single-family homes rose 6.4% in April to an annual rate of 433,000, beating economist expectations.
The ICE dollar index DXY +0.16% , which pits the greenback against six other currencies, rose to 80.374 from 80.226 late Thursday. That’s the highest level in seven weeks, pushing the index to a weekly gain of 0.4%. The WSJ Dollar Index XX:BUXX +0.12% , another gauge of dollar strength, rose to 73.16 from 73.07.
Treasuries making a reversal
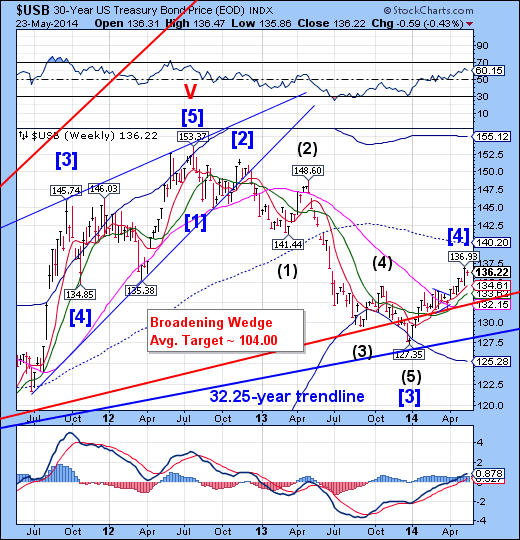
The Long bond has reached its peak on May 15, within its Cycle Turn window.USB has a date with a major Cycle bottom by early June.The rally may have beenbe a bull trap for the unaware.
WSJ: Treasury bonds strengthened Friday, ahead of a long weekend, as buyers were lured in by cheaper prices after two days of selling.
The bond market closed at 2 p.m. EDT and will remain shut Monday for Memorial Day. At the end of the shortened session, the 10-year Treasury note was 5/32 higher in price, yielding 2.536%, according to Tradeweb. Bond prices and yields move in opposite directions.
The price action underscores resilient demand for U.S. government debt at a time when investors continue to fret about the uneven pace of global economic growth. U.S. labor market and housing data this week have kept alive the question of how robustly the world's largest economy is likely to grow this year after a harsh winter.
Gold closes a third week virtually in place
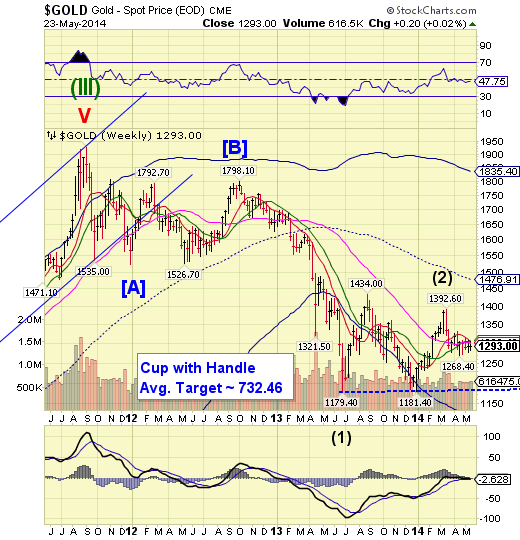
Gold has made four weekly closings within a 6-point range beneath weekly resistance.
The inability to close above resistance at 1300.00 on a weekly basis is instructive. It appears that the decline may resume again early next week, with much deeper lows.
CNNMoney: It was all over in 10 minutes, but it cost Barclays nearly $44 million and landed another blow to the giant bank's reputation.
Nearly two years ago, a Barclays trader took advantage of weak internal controls in a bid to rig the price of gold and profit at a customer's expense.
On Friday, Barclays (NYSE:BCS) was fined £26 million, or nearly $44 million, by British regulators. Public documents lay out how the trader was able to slip through the bank's oversight.
Crude makes a “second chance” rally
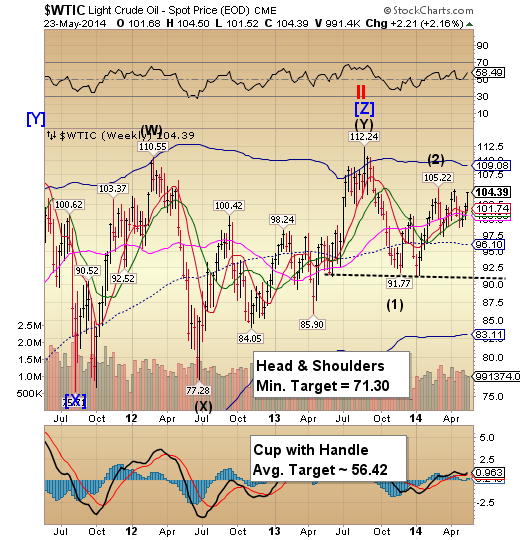
Crude Oil made a second attempt at overtaking its previous highs this week, without success.Friday’s high was an extended, inverted Trading cycle, which indicates a potential decline over the next several weeks.Tuesday may bring a change of trend to WTIC.
FoxBusiness: U.S. oil prices rose to a one-month high Wednesday after a government report showed a large drop in crude stockpiles when analysts were expecting a small increase.
Light, sweet crude for delivery in July gained $1.74, or 1.7%, to $104.07 a barrel on the New York Mercantile Exchange, the highest close since April 21. Brent crude futures on the ICE Futures Europe exchange ended 86 cents, or 0.8%, higher at $110.55 a barrel.
The U.S. Energy Information Administration said domestic oil stockpiles fell 7.2 million barrels in the week ended May 16, the biggest weekly decline in more than four months, while analysts surveyed by The Wall Street Journal expected an increase of 700,000 barrels. The drop was driven by a slide in imports of crude to a 17-year low, averaging 6.5 million barrels per day.
China also makes a third bounce off its neckline
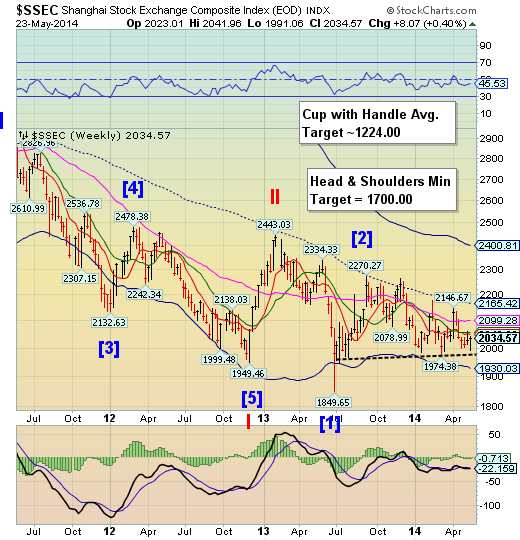
The Shanghai Index found support at its Head & Shoulders neckline a third time, but failed to overtake Short-term resistance at 2049.86. It may now resume its descenttoward the neckline of its Head & Shoulders formation. This will now allow the Primary Cycleto continue by declining through the Head & Shoulders neckline. There is no support beneath its Cycle Bottom at 1930.03.
ZeroHedge: While US central bankers shudder at the idea of admitting their could be a bubble in real estate or stocks (unless its obvious in hindsight); and England's Bank of England explains 'if there is a bubble, it's not their fault, but there isn't so there'; it appears the Chinese are more comfortable with the truth. As Bloomberg BusinessWeek reports, China's central bank Governor Zhou Xiaochuan said, China may have a housing bubble only in “some cities,” - an issue that’s difficult to resolve with a single nationwide policy.As concerns mount of dramatic over-supply on the back of extrapolated urbanization dreams, Zhou notes, “The economy has slowed down a bit, but not very much," adding that "we should keep vigilance on whether it continues to slow down." Which is odd because US talking heads have made up their minds that China is fixed.
The Banking Index gives a weak bounce at Long-term support
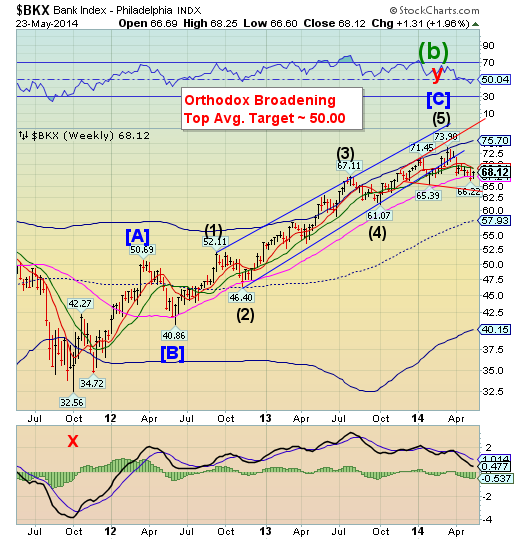
After challenging Long-term support at 67.24, BKXhas managed a weak bounce that could not overtake the higher resistance levels. A further decline from here may complete its Orthodox Broadening Top formation by breaking the bottom trendline. The next target is below its Orthodox Broadening formation near 62.50.A bounce from beneath the Broadening Top may heighten the probability of a flash crash soon after.
ZeroHedge: Today, it's Deutsche Bank's turn to voice a lament on the topic of uber-manipulated, rigged markets. From Jim Reid:
Perhaps the Fed and other central banks are controlling the market too much these days with their guidance. In the old days central banks used to like to create an element of surprise to ensure that markets didn't become complacent. With the crisis fresh in people's minds, with the stock of debt still huge and with the recovery still so uncertain they feel they cannot risk creating too much uncertainty at the moment. The risk to this strategy is clearly that bubbles can build with so much central bank visibility and also that if they do have to change course suddenly it could create more problems due to the surprise factor in markets positioned for stability. Anyway for now low vol(atility) rules.
Reuters: Joseph and NeidinHenard thought they had finally fixed the mortgage that was crushing them.
In January, the couple reached a settlement with every company that had a stake in the mortgage on their house in Santa Cruz, California, a deal that would have slashed their monthly payment by almost 40 percent to $3,337. It was the end of a process that started with their defaulting in 2009.
But when they saw the final paperwork for their settlement, they found that Ocwen Financial Corp, the company that collected and processed their mortgage payments, had added an extra clause: they could not say or print or post anything negative about Ocwen, ever.
ZeroHedge: One of Portugal's biggest companies - Espirito Santo International SA - is in a "serious financial condition" according to a central bank driven external audit by KPMG identified "irregularities in its accounts." Rather stunningly, the details are nothing short of ponzi-like as WSJ reported in December that Espírito Santo International was highly leveraged and had been relying heavily on selling debt to an investment fund held by the financial group (i.e. funding debt issuance in one entity with another) and overvaluing hard-to-value assets (ring any bells?).
Disclaimer: Nothing in this email should be construed as a personal recommendation to buy, hold or sell short any security. The Practical Investor, LLC (TPI) may provide a status report of certain indexes or their proxies using a proprietary model. At no time shall a reader be justified in inferring that personal investment advice is intended. Investing carries certain risks of losses and leveraged products and futures may be especially volatile. Information provided by TPI is expressed in good faith, but is not guaranteed. A perfect market service does not exist. Long-term success in the market demands recognition that error and uncertainty are a part of any effort to assess the probable outcome of any given investment. Please consult your financial advisor to explain all risks before making any investment decision. It is not possible to invest in any index.
