Our market timing model has a 19-year history of keeping us out of harm’s way when stocks suddenly reverse. Here’s what the model is telling us about the current state of the NASDAQ.
Our stock trading strategy is based on capturing moves of 20-40% (or more) in high relative strength growth stocks in a clear uptrend.
We also like to see the major indices in a clear uptrend, which puts the wind on our back.
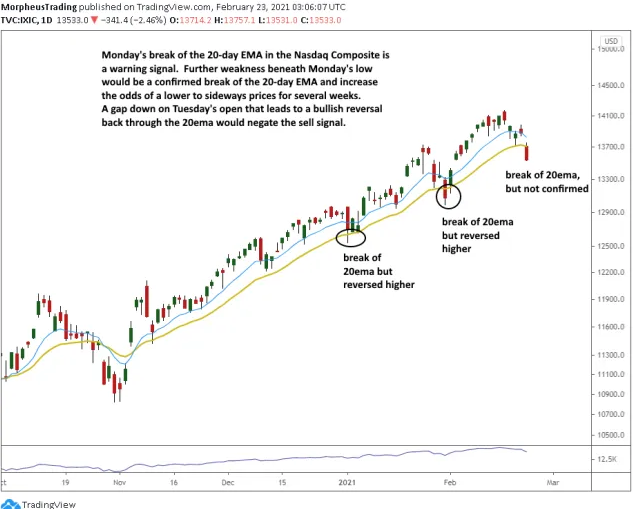
With Monday’s (Feb. 22) close below the 20-day exponential moving average in both the NASDAQ and S&P Midcap Index (MDY), the dominant market uptrend is now in danger of reversing.
A closing price below Monday’s low in the NASDAQ Composite would confirm the break of the 20-day EMA, and increase the odds of lower to sideways price action during the next few weeks.
Proven Power of the 20-day EMA
As we have seen in the past, there could be a false break of Monday’s low that leads to a quick reversal back above the 20-day EMA. Such a move would negate the sell signal.
No indicator is perfect, but the break of the 20-day EMA is a simple and reliable way to let us know when the wind is no longer at our back.
Prior to now, there have been two previous tests of the 20-day EMA this year.
On the chart below, notice how the 20-day EMA (beige line) perfectly acted as support to keep the uptrend intact:

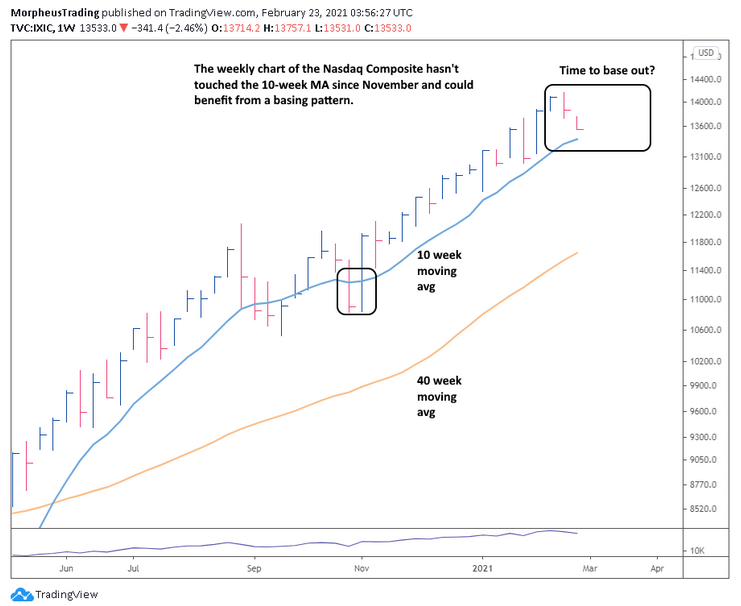
When doing broad market analysis, it’s also important to look at the longer-term weekly chart time frame to remove the 'noise' from the shorter-term charts.
On the weekly chart below, notice the NASDAQ is coming into support of its 10-week moving average.
A few weeks of base building near current prices (consolidation) would be ideal.
Notice the NASDAQ Composite has not touched the 10-week MA since November 2020:

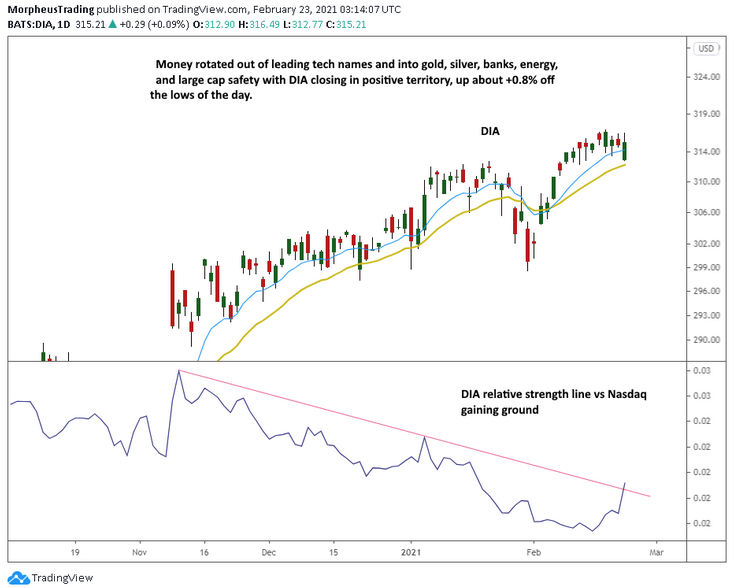
Price action in leading stocks has definitely been ugly in recent days, but we have actually been seeing sector rotation out of tech leadership and into lagging industry groups.
Notice how the blue-chip Dow Jones Industrial Average actually closed positive on Monday with a bullish reversal candlestick:

3 Strikes? Time to Sit on the Sidelines
When determining the health of the market, we first start with the price and volume action in current open positions and leading growth stocks.
We then move to the major indices.
When we get three sell signals (three strikes), we immediately tighten stops on existing positions and avoid new buy entries until conditions improve to generate a new buy signal in our proprietary market timing model.
Currently, we have:
- Strike 1 – New buy entries in our Wagner Daily model portfolio have failed to impress with substantial gains.
- Strike 2 – Top growth stocks have struggled the past few weeks, with little to no follow through on breakout attempts (including failed breakouts).
- Strike 3? – If the NASDAQ Composite closes below its 20-day EMA, the index is no longer in a clear uptrend.
In today’s swing trading report, we notified readers that we are now shifting to cash by avoiding new trade entries and greatly tightening stops on the few remaining positions.
CASH is always a valid position—we are quite content to wait on the sidelines and protect our massive gains of recent months.
As history has proven over the years, our rule-based market timing model does a fantastic job of quickly and automatically getting us out of harm’s way when stocks suddenly reverse.
