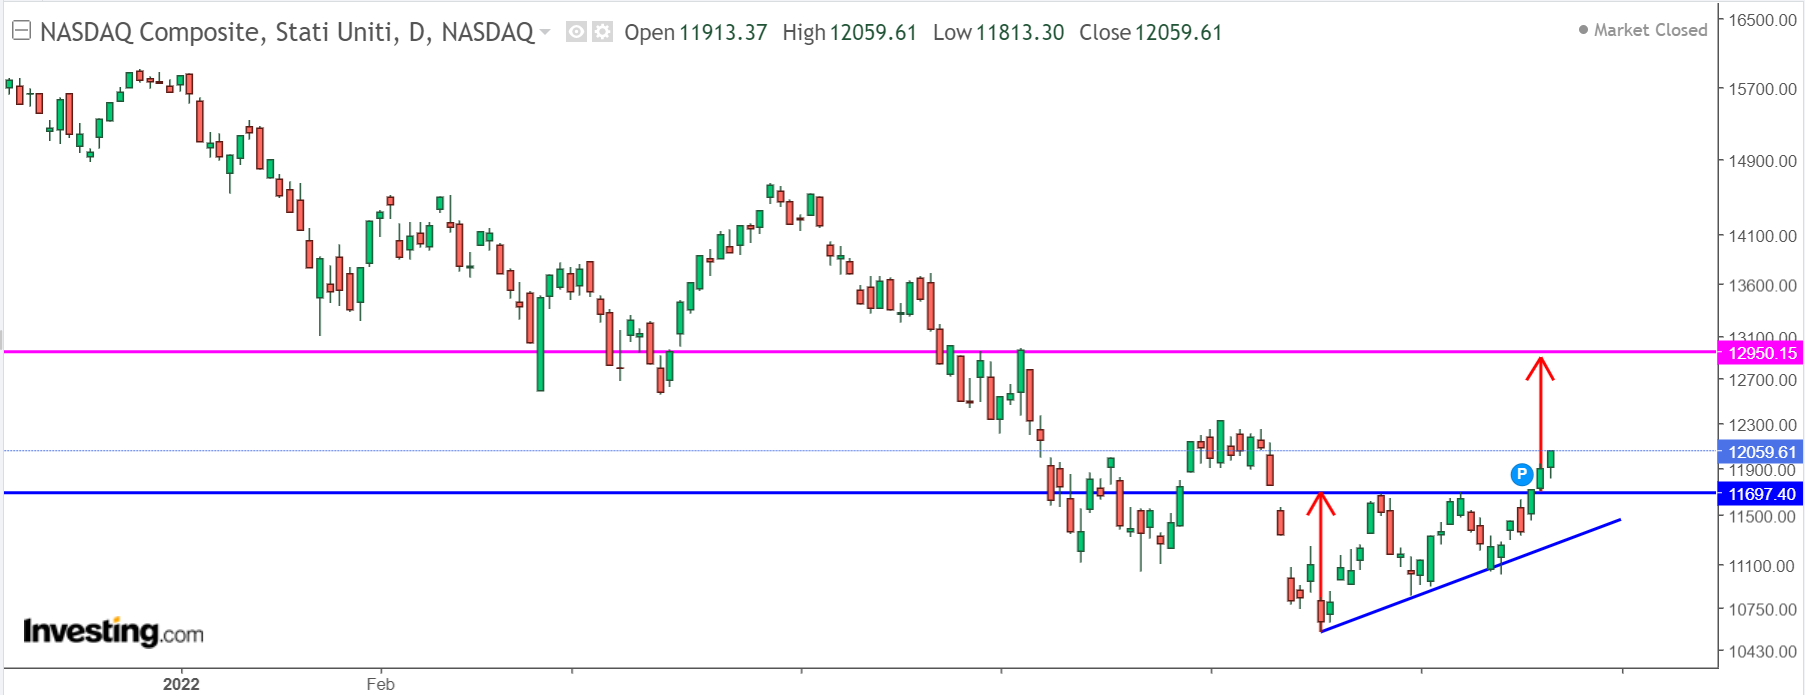
- The NASDAQ composite is showing signs of a trend reversal with an ascending triangle figure
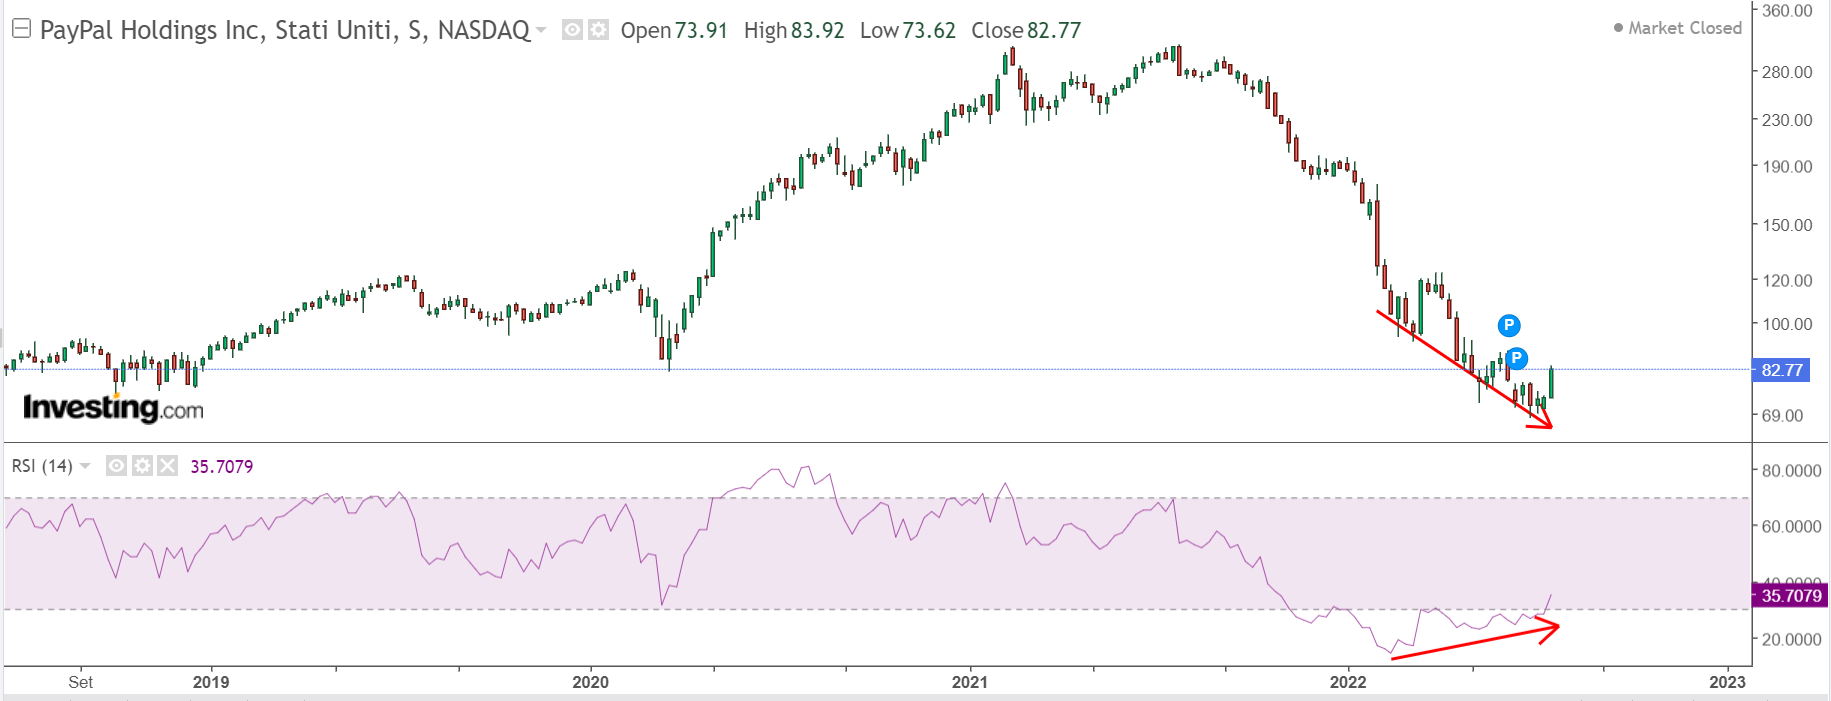
- Index components show bullish divergences on indicators and prices
- Investors should keep in mind that bounces (even major ones) are a completely normal phenomenon in bearish trends
The recent price rebound in the NASDAQ Composite indicates that the bear market trend seen for the first seven months of the year could be on the verge of a major reversal.
In the image below, we can see how higher lows with flat highs went right into forming a classic ascending triangle figure. This setup is typically a bullish trend continuation pattern, but it can be a reversal figure when found in a broader bearish trend.
On the daily chart, the confirmation of this figure came with the break of $11,690 area highs (second-last green candle).
To project a possible target (according to academic theory), we replicate the distance from the lowest low (about 10,575) to the first short-term high (about 11,690) as the distance from a possible target point in the short term (taking us to about 12,950 points).
The next test for this figure should be at the previous short-term high of $12,230. Therefore, traders must remain on their toes as today and next week will likely give us more clues about this movement.
What's Next: Reversal Or Continuation Of The Descent?
As always in technical analysis, we have to follow a trend, not anticipate it. Here, we might consider two factors (one for reversal and one for descent):
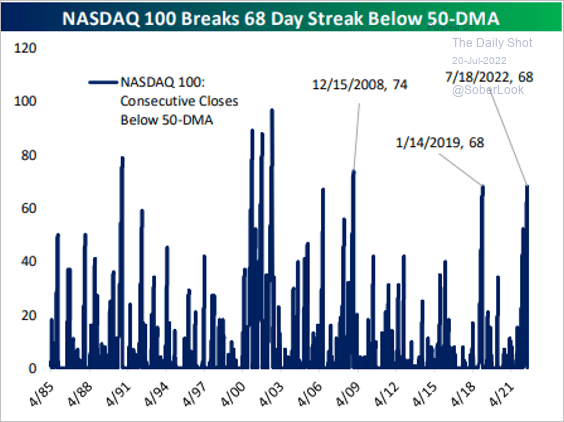
Regarding the possible trend reversal, I point out how the NASDAQ 100 reached a record number of sessions (68) below the 50DMA (see photo below). Usually, when there are such long records, it is a signal of possible market bottoms.

Source: thedailyshot
In fact, many Big Tech stocks (see PayPal Holdings (NASDAQ:PYPL) pictured, for example) also show a bullish divergence between prices and indicators, reinforcing the case for a broad-based rebound, at least in the short term. 
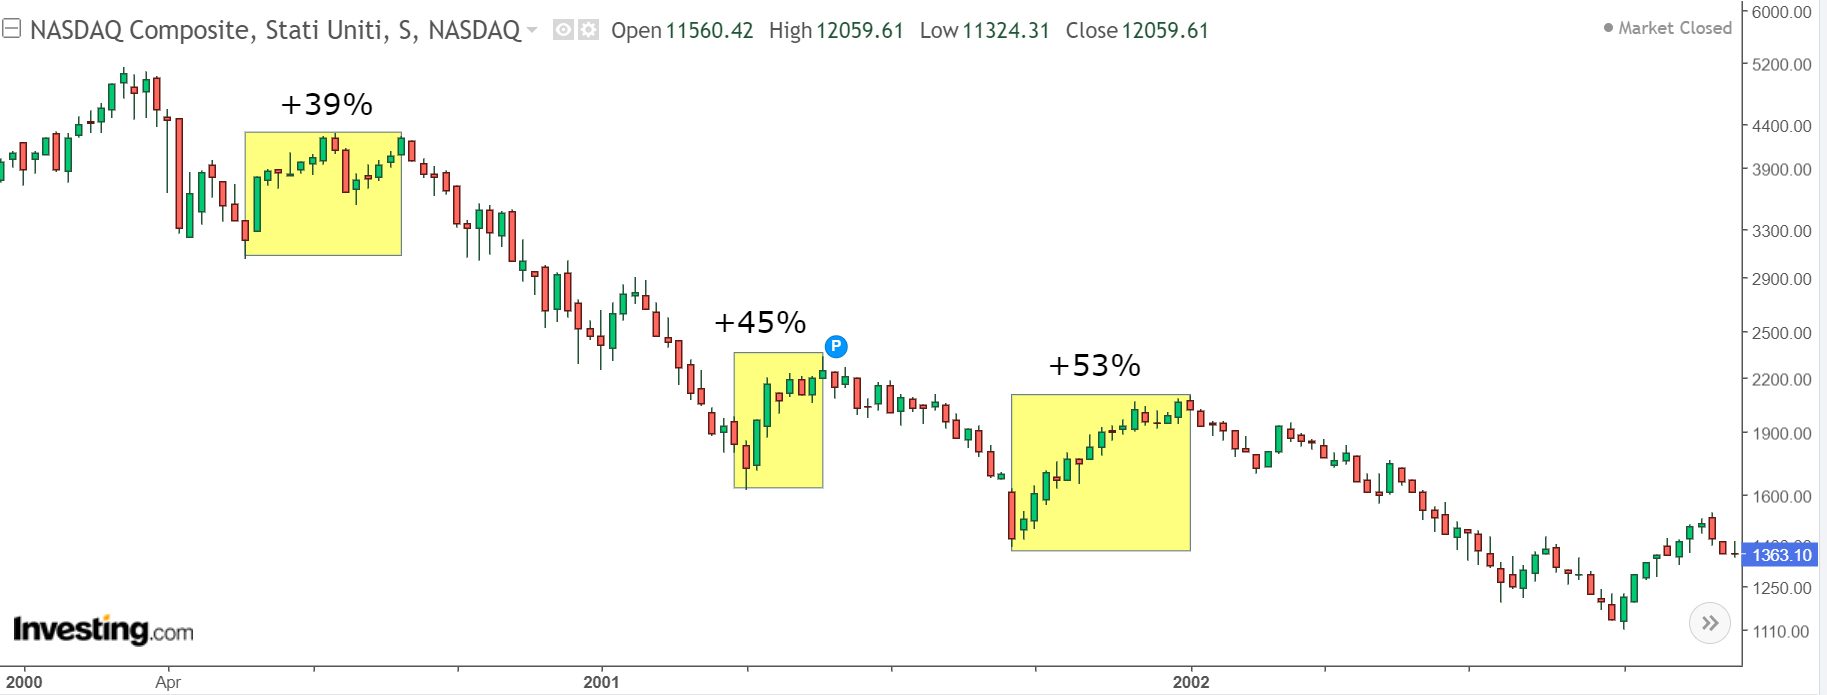
The bear market case, on the other hand—as in the chart below—argues that bounces (even major ones) in bearish trends are a completely normal phenomenon.
In fact, I have included in the picture above the rebounds (yellow box) in the bear market period of the dotcom bubble. Despite bounces of even more than 50%, we can see how the market eventually collapsed anyway in the long run.
So as always, having a diversified strategy with cash management, fractional entries, diversification, and a correct time horizon is the best option.
Time will tell if we are right, but the charts to date look well set.
Disclosure: The author is currently long on the NASDAQ 100.
***
Interested in finding your next great idea? InvestingPro+ gives you the chance to screen through 135K+ stocks to find the fastest growing or most undervalued stocks in the world, with professional data, tools, and insights. Learn More »
