NASDAQ Breadth Reaches 2011 Oversold Levels

Published 02/15/2016, 12:07 AM
Updated 07/09/2023, 06:31 AM
DJI
-
US2000
-
IXIC
-
DJT
-
NYA
-

Tech and Large Cap indices sit on the border between a bear market or a steep correction. While Small Caps have fallen into bear market territory, there is still a chance for other indices to come in from the precipice. The most bullish of these markers is NASDAQ Breadth metrics. NASDAQ Bullish Percents and Percentage of NASDAQ Stocks above the 200-day MA have dropped to levels last seen during 2011 lows.
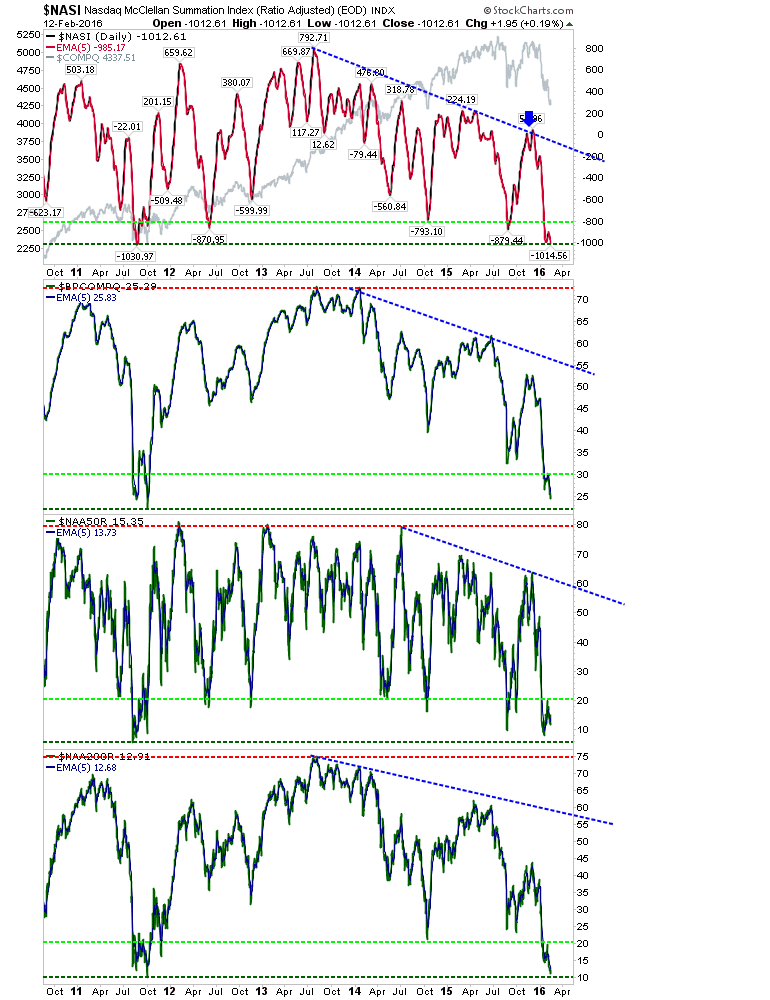
NASI Daily 2006-2016

The relationship between new highs and lows in the NYSE is also building a head of steam. There is no clear marker for a low, but action here is approaching levels last seen during the worst of the credit crisis.
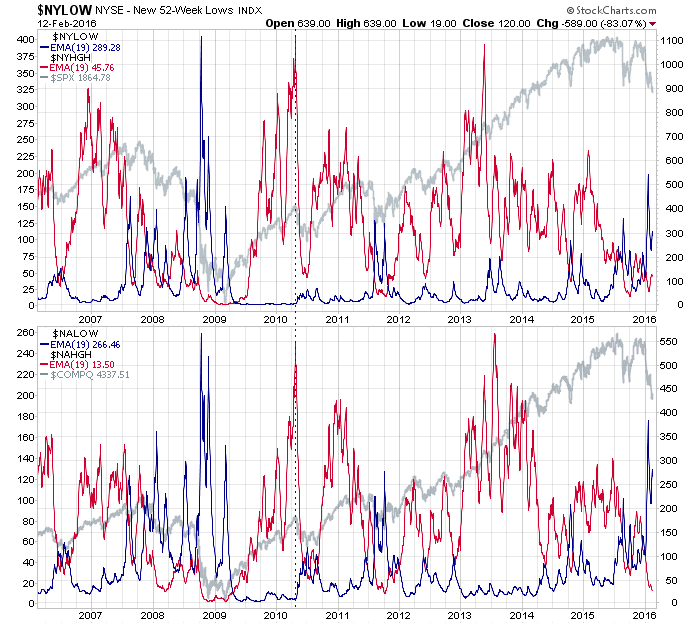
NYSE Highes/Lows 2006-2016
The Transports are not quite there. The 2011 level has been breached, but it hasn't yet gone as far as 2009 levels. Technicals are showing clearer bottom markers than price action.
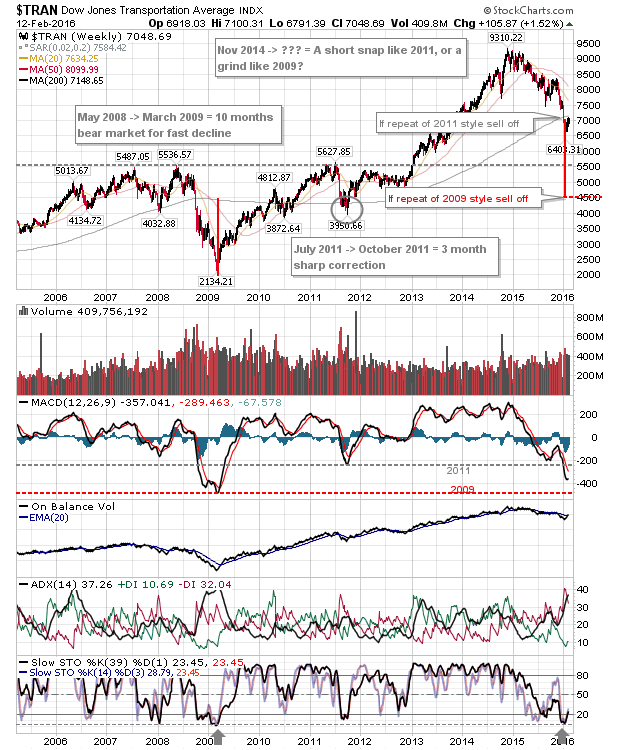
TRAN Weekly 2005-2016
The bear market Russell 2000 is approaching the measured move target from the head-and-shoulder pattern; it's above 50 points away from Friday's close. The weekly chart finished with a bullish hammer, so watch for a stronger close which may mark this coming week as the swing low week.
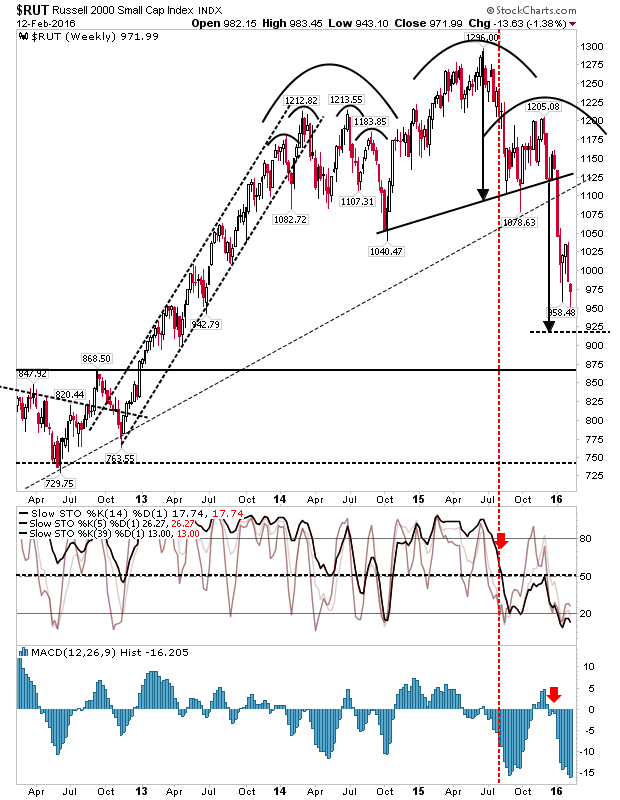
RUT Weekly
The weekly chart of the Dow has generated a number of spike lows around 15,550. If this level breaks, then it will be heading to 14,750. Stochastics are pointing to a bear market, but price action is holding lows.
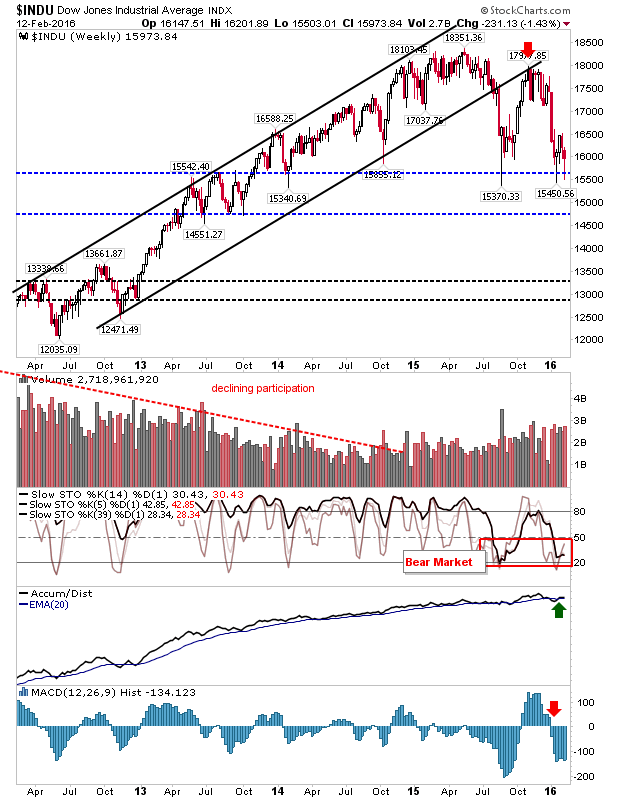
INDU Weekly
The NASDAQ may be shaping a downward channel, which if true, could be looking at a bounce back to 5,000. Technicals are deeply oversold.
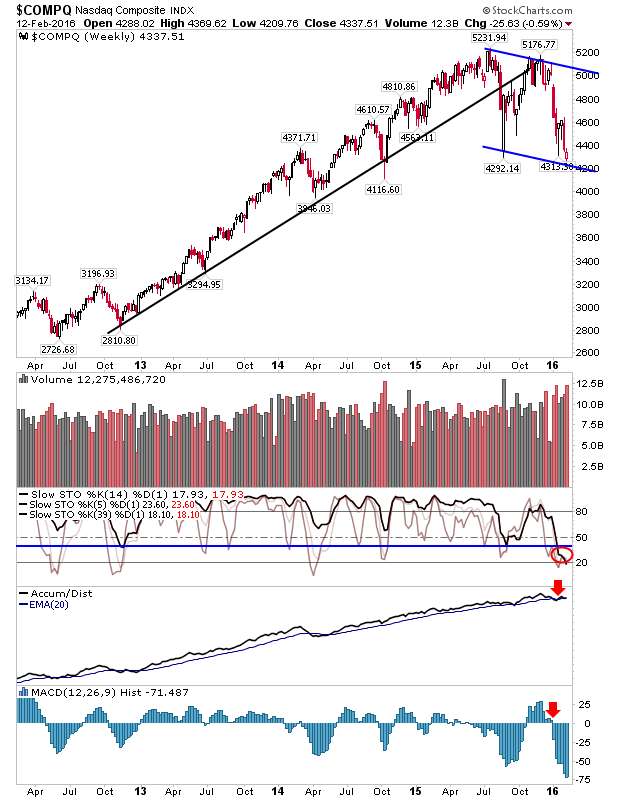
COMPQ Weekly
Monday is the start of a new week and a chance to confirm a low in the markets. Daily charts showed decent gains, albeit on light volume, but more will be needed if value buyers are to step in and take control.

Latest comments

Loading next article…
Risk Disclosure: Trading in financial instruments and/or cryptocurrencies involves high risks including the risk of losing some, or all, of your investment amount, and may not be suitable for all investors. Prices of cryptocurrencies are extremely volatile and may be affected by external factors such as financial, regulatory or political events. Trading on margin increases the financial risks.
Before deciding to trade in financial instrument or cryptocurrencies you should be fully informed of the risks and costs associated with trading the financial markets, carefully consider your investment objectives, level of experience, and risk appetite, and seek professional advice where needed.
Fusion Media would like to remind you that the data contained in this website is not necessarily real-time nor accurate. The data and prices on the website are not necessarily provided by any market or exchange, but may be provided by market makers, and so prices may not be accurate and may differ from the actual price at any given market, meaning prices are indicative and not appropriate for trading purposes. Fusion Media and any provider of the data contained in this website will not accept liability for any loss or damage as a result of your trading, or your reliance on the information contained within this website.
It is prohibited to use, store, reproduce, display, modify, transmit or distribute the data contained in this website without the explicit prior written permission of Fusion Media and/or the data provider. All intellectual property rights are reserved by the providers and/or the exchange providing the data contained in this website.
Fusion Media may be compensated by the advertisers that appear on the website, based on your interaction with the advertisements or advertisers.
© 2007-2025 - Fusion Media Limited. All Rights Reserved.