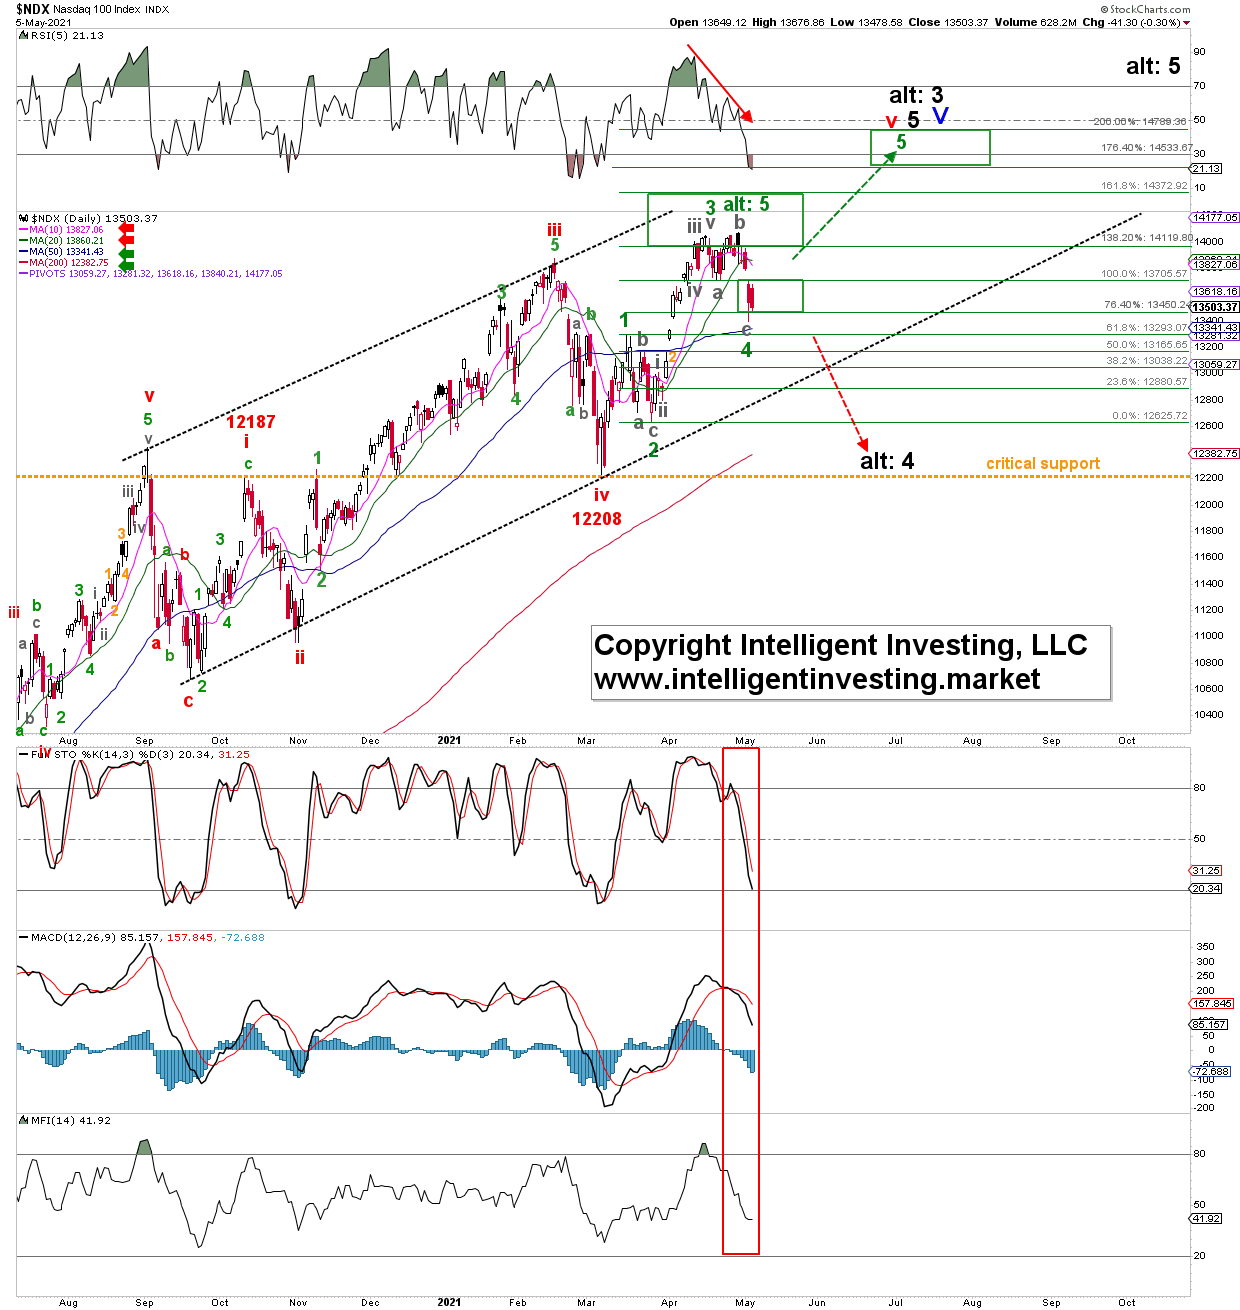
Over the past several weeks, I have been tracking a standard, Fibonacci-based Elliott Wave Principle (EWP) impulse pattern higher for the Nasdaq 100. Three weeks ago, I was looking for a (green) 3rd wave top between 14178-14428, see Figure 1 below. Then a 4th wave down to 13525-13735 followed by a last (green) wave-5 to ideally 14645-14890. On April 28, the index topped at 14073, 100p (0.7%) below my ideal target zone. It is now trading at 13500. Thus, it appears the impulse pattern unfolded pretty much as expected. However, there’s now a twist to it. Yes, markets are straightforward for a while, then they become difficult again. This pattern repeats itself because if one knew what the market would do next, all the time, it would no longer function.
Figure 1: NDX 100 daily candlestick chart with EWP count and technical indicators:

What is that twist?
Well, if the bulls are not careful, the April 28 top could already have been the green wave-5, labelled as green “alt: 5” in Figure 1.
Namely, if the index trades below the green wave-1 high (13297 high made March 16) going forward without creating a new all-time high first, then the current decline cannot be a 4th wave any more (as shown in Figure 1) because in an impulse wave 4th and 1st waves cannot overlap, according to the EWP rules. Only in a diagonal is such overlap allowed. See here.
Yesterday, however, the NASDAQ Composite already overlapped with its March 16 high; thus, the NDX is on severe watch as only the ending diagonal remains on the bullish table, and these are unreliable structures. Instead, I would like to focus on the dotted red arrow down to (black) “alt: 4”. Namely, if we see such overlap, it is most likely the index has completed a larger 3rd wave top and is now completing a larger 4th wave, back down to ideally around the mid-12000s. Then one final wave-5 should commence before the index is finally ready to wrap up the rally that started March 2020 and March 2009. With all the technical indicators currently on a sell (red box) and price below its 10d and 20d SMA, I prefer to look lower, and the high-14000s may have to wait for quite some time.
Conversely, the index will have to close back above its 10-day and 20-day SMA from current levels (dotted green arrow) to give that (green) wave-5 a chance. Thus, once again, the index showed us, all we can do is “anticipate, monitor, and adjust” as things were tracking along well until yesterday.
