- The Fed's hawkish tone has rattled markets, setting a cautious tone for year-end trading.
- Key support levels on the Nasdaq 100 and S&P 500 could dictate the next big moves.
- Reduced holiday trading volumes may pause the selloff but leave room for volatility in the new year.
- Take advantage of our Extended Cyber Monday offer—your last chance to secure InvestingPro at a 55% discount!
The bulls started the month strong, fueled by optimism and an expectation that the year would close on a high note. Investors anticipated no surprises from the Federal Reserve, and a 25-basis-point rate cut seemed all but guaranteed.
While the Fed delivered the expected cut, its hawkish guidance—reducing the outlook for rate cuts next year from 100 basis points to just 50—sent shockwaves through the market. The shift in tone has rattled investors, triggering sharp declines across major U.S. indexes.
Recent sessions have underscored this unease, with dynamic selloffs dominating the charts. With the holiday season approaching, market volatility could ease temporarily, leaving major moves and settlements likely postponed until the new year.
With that in mind, here's a technical overview of how the indexes might fare as the week comes to an end.
Nasdaq 100 Eyes Critical Support Levels
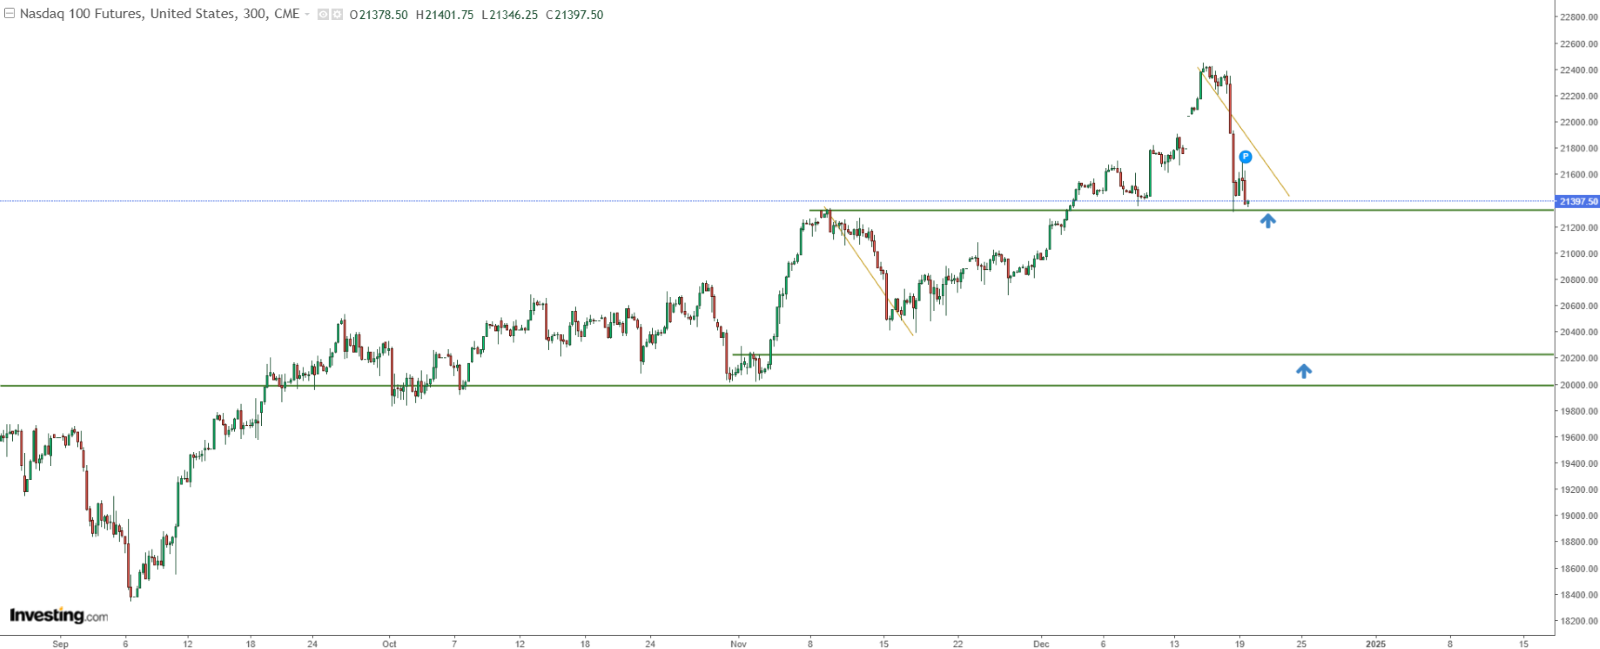
The Nasdaq 100, a bellwether for technology stocks, is grappling with a strong downward impulse. Prices have reached a critical confluence zone, aligning with the last correction in the downtrend after the 21,400 support level gave away.
Buyers tried to show some reaction here, but the base case suggests a potential breakout lower.

If the selloff continues, the next significant target lies around the 20,000-point cluster. For now, reduced holiday volatility could temporarily slow the bearish momentum, with the 21,400 level keeping the tech index in check.
S&P 500 Targets Deeper Declines
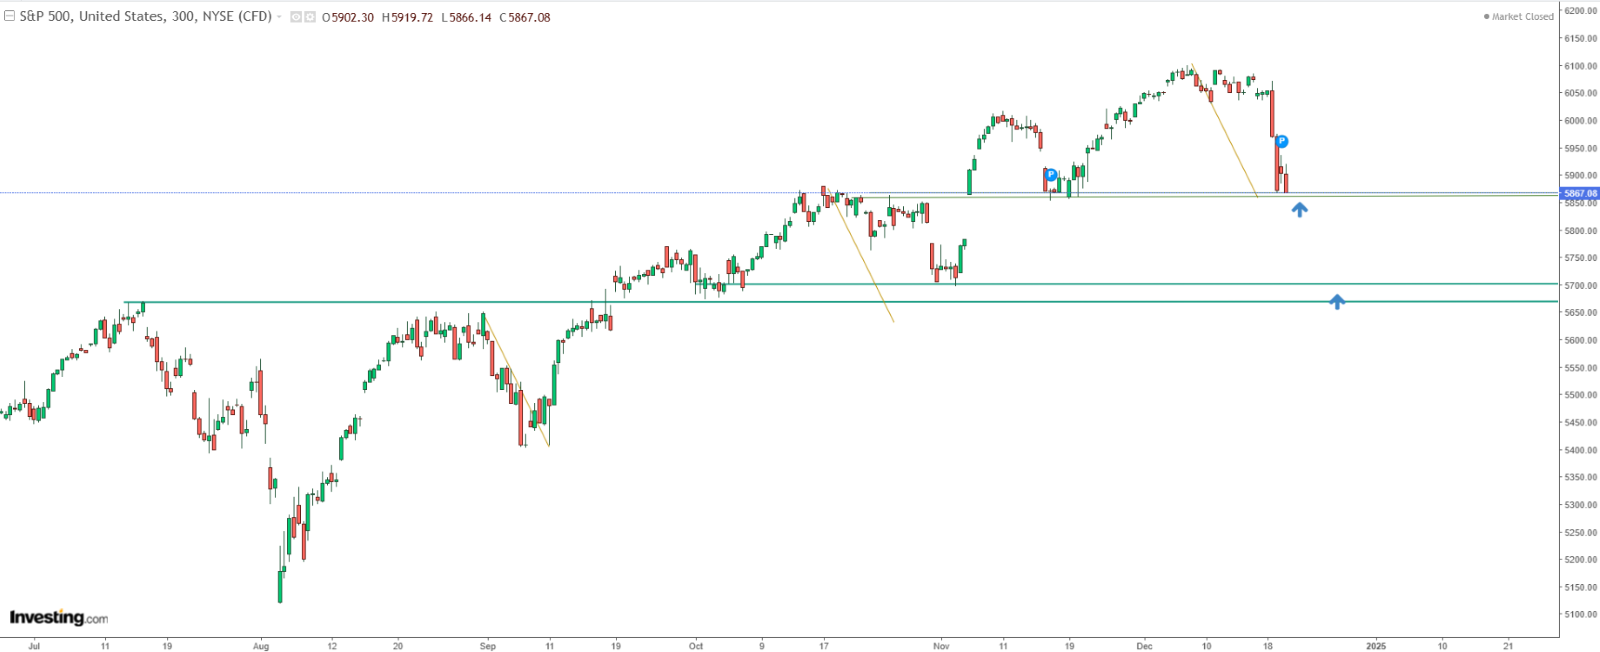
The S&P 500 has mirrored the Nasdaq's trajectory, sliding sharply to test support at the 5,860-point zone. The tepid response from buyers highlights bearish dominance and a continued move south appears likely—if not immediately, then potentially after the holiday lull.

A hawkish Fed alone might not reverse this trend. Should the downward correction extend, the next key support level to watch sits near 5,700 points.
DAX Extends Losses
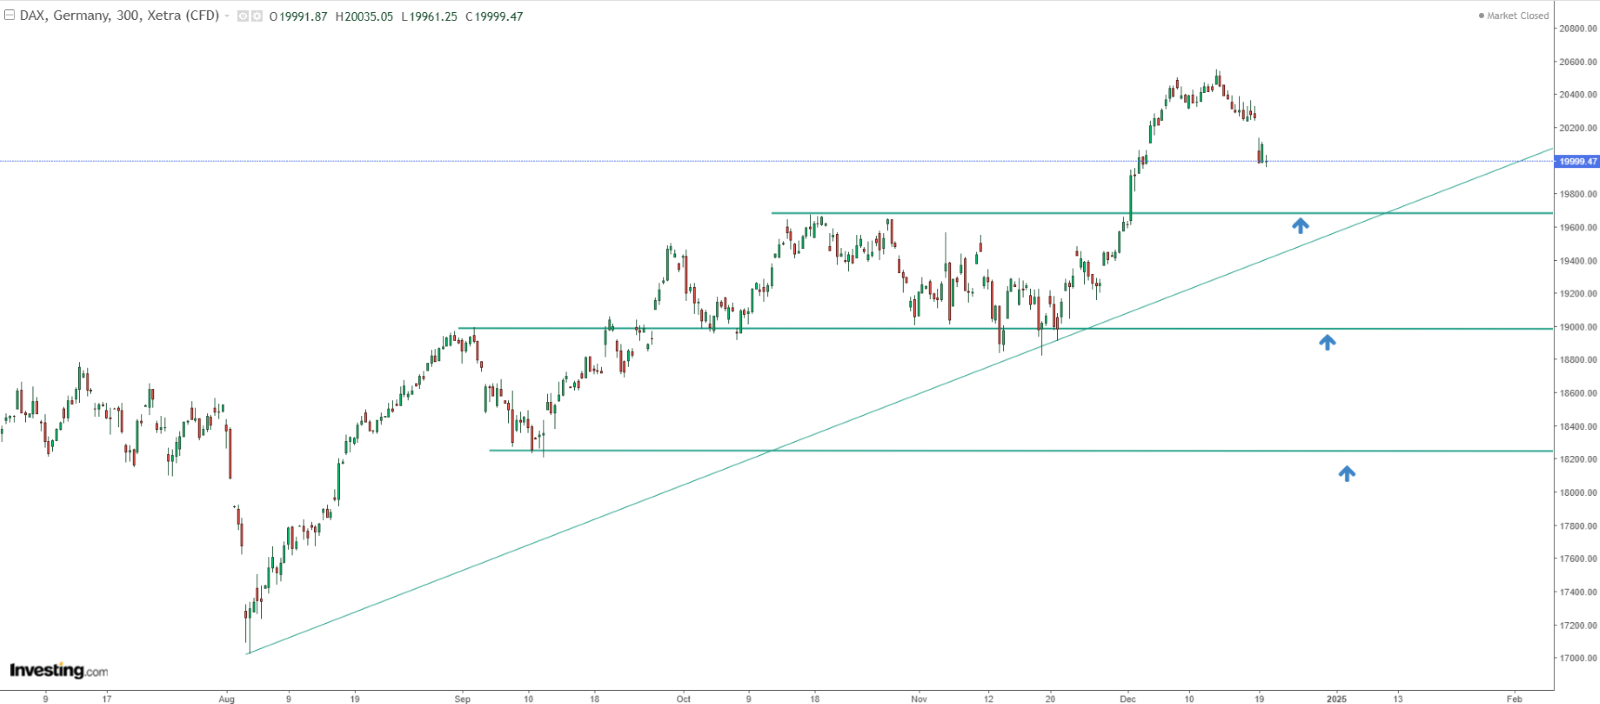
The Federal Reserve’s impact isn’t confined to U.S. markets—it’s rippling through European exchanges as well. The DAX, Germany’s flagship index, remains firmly in decline.

With room to deepen its correction, the first target appears at the 19,700-point support level, bolstered by an upward trendline.
This area could prove pivotal for the DAX’s trajectory. A break below 19,700 points might set the stage for a test of the psychologically significant 19,000-point barrier.
Looking Ahead
As the year winds down, markets are grappling with the implications of a less accommodative Federal Reserve.
While thinner holiday trading may temper volatility in the short term, the bearish tone across major indexes suggests further downside potential in the months ahead.
***
Take advantage of our Extended Cyber Monday offer—your last chance to secure InvestingPro at a 55% discount—and gain insights into elite investment strategies and access over 100 AI-driven stock recommendations every month.
Interested? Click on the banner below to discover more.
Disclaimer: This article is written for informational purposes only. It is not intended to encourage the purchase of assets in any way, nor does it constitute a solicitation, offer, recommendation or suggestion to invest. I would like to remind you that all assets are evaluated from multiple perspectives and are highly risky, so any investment decision and the associated risk belongs to the investor. We also do not provide any investment advisory services.

