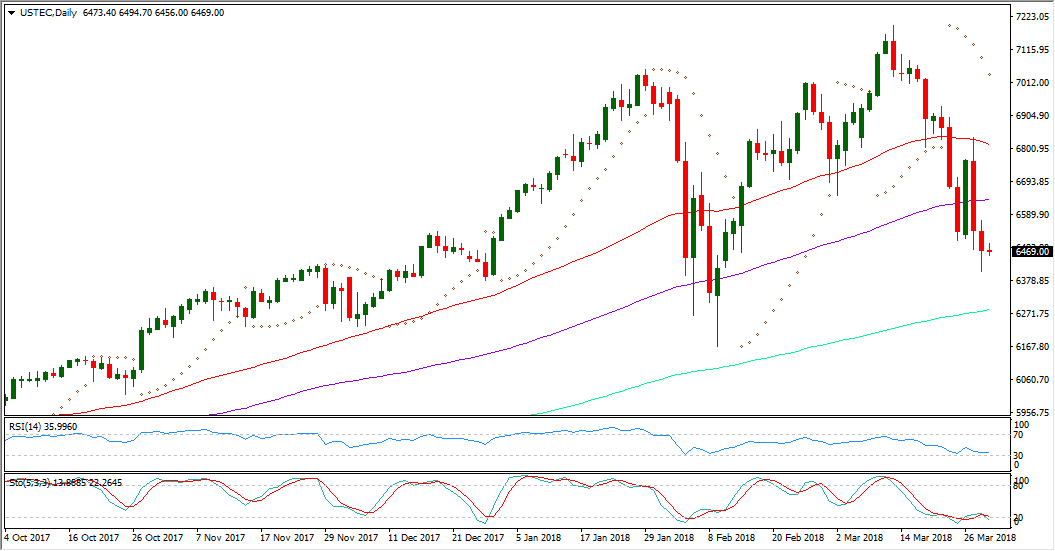
This new steep slide of the US major Equities indexes put the investors in more doubts about the ability of these indexes to rebound again, as they have done repeatedly since February 2016 bottoms with minimal degree of volatility.
Technology shares leaded the slide and weighed on the market sentiment this week following Facebook (NASDAQ:FB) privacy crisis which drove its share down with no realized bottom yet.
The current higher interest rate outlook in US undermined the equities investors' trust in watching reliable buying back money over the short term, After the yield curves could prompt the equities correction by the end of last January.
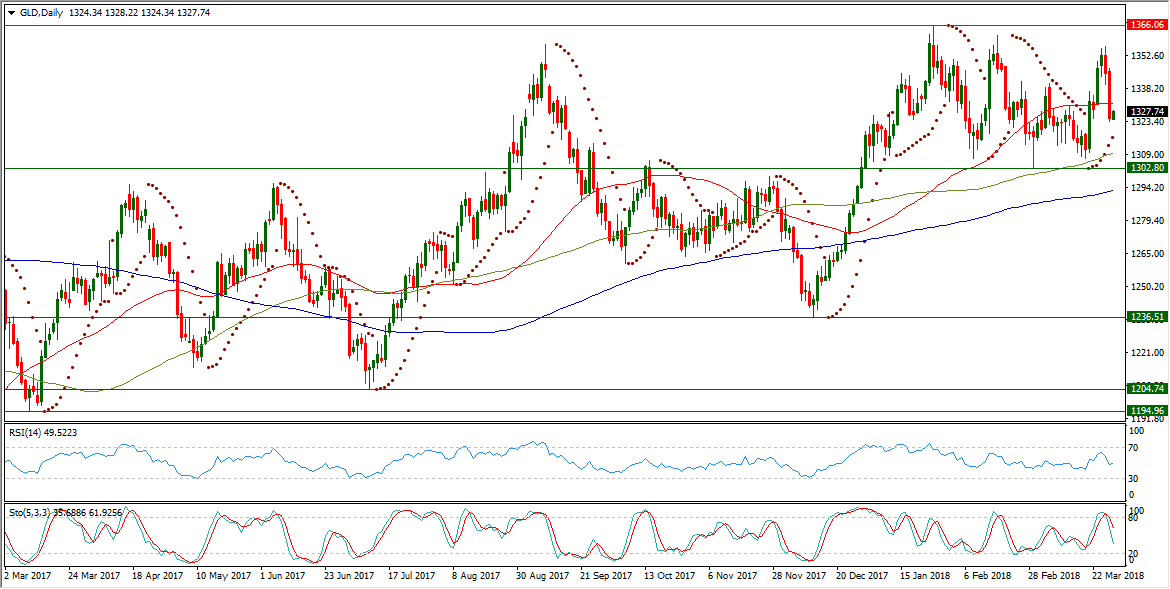
We could see yesterday obviously stronger dollar against its counterpart major currency and versus the gold, despite the strong demand for Treasuries which drove their yields down in the secondary money market without distinction and collectively.
The current lower yields in the money market could work on reemerging demand for assets, but this has not been materialized yet, after the worries about the war trade could temper the market sentiment this month adding to the outlook more dovish scenarios.
XAU/USD Daily Chart:

"Buying the greenback selling gold" was the advice of the new White House’s top economic adviser appointee Larry Kudlow who replaced the resigned Gary Cohn in change amid conflicts about the protectionism and the Trade War consequences.
While the growing diplomatic efforts for reaching a deal with N. Korea are weighing down on the demand for gold which has been boosted several times in the recent years by N. Korea Nuclear tests. From another side, The ouster of the secretary of state Rex Tillerson has been replaced by the CIA director Mike Pompeo who prompted more worries about the future of Iran deal with the west sending the oil prices up this week to their highest levels since last Jan. 29.
NASDAQ 100 Future Daily Chart:

The signs of diplomatic breakthrough of the Korean crisis could not encourage the Asian investors to load assets, but BOJ chief Governor could make it today by making USD/JPY more well-buoyed, after his remarks about the need for sticking to the ongoing ultra easing monetary policy.
After diving to 104.62 in the beginning of this week Kuroda's remarks sent USD/JPY up to 107 level boosting demand during the Asian session for the Japanese exporting companies which sent by their turn Nikkei 225 up, Despite the US indexes future rates existence deeper in the red territory, amid growing worries about the outlook of the technology stocks which could not gather buying back until now.
After The US administration announced that it's to consider capping of the Chinese investments into The US technology sector to punish it for intellectual property rights violations.
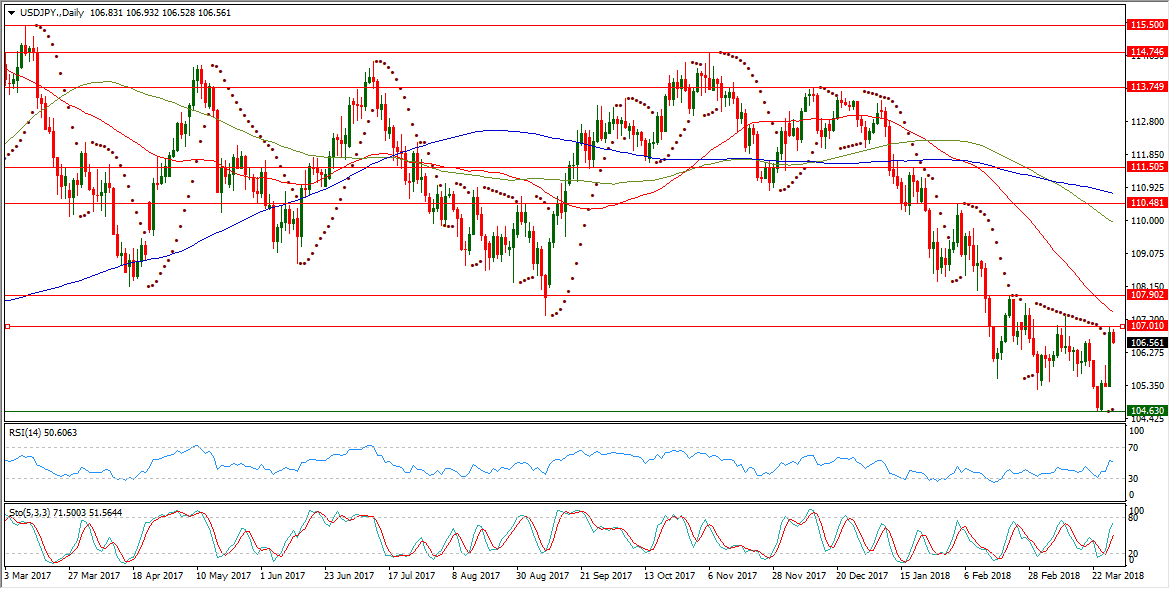
USD/JPY Daily Chart:

After forming a lower low at 104.62, USD/JPY could bounce up touching 107 level before residing for trading near 106.60 during the Asian session.
USD/JPY rising yesterday to 107 level drove it be again above its daily Parabolic SAR (step 0.02, maximum 0.2) which is reading today 104.67 in its second day of being below the trading rate.
The downside momentum of USD/JPY eased down, but it is still undermined by continued trading well below its daily SMA50, its daily SMA100 and also its daily SMA200.
USD/JPY is still vulnerable to the downside, as it is still exposed to forming lower high below 107.90 resistance which has been last Feb. 21 high.
Forming series of lower highs made the pair descending channel which reached lower low at 104.62 on increasing of the downside momentum following breaking key supporting level at 105.24 which has been last Mar. 2 low.
USD/JPY daily RSI-14 is referring now to existence in a higher place inside its neutral territory reading 50.606.
USD/JPY daily Stochastic Oscillator (5, 3, 3) which is more sensitive to the volatility is having now its main line inside its neutral region at 71.500 leading to the upside its signal line which is lower in the same region at 51.564, after convergence to the upside by bottoming out at 104.62 inside its oversold area below 20.
Important levels: Daily SMA50 @ 107.41, Daily SMA100 @ 109.93 and Daily SMA200 @ 110.77
S&R:
S1: 104.62
S2: 101.18
S3: 100.07
R1: 107.01
R2: 107.90
R3: 110.48
