Another Early Warning Siren Goes Off
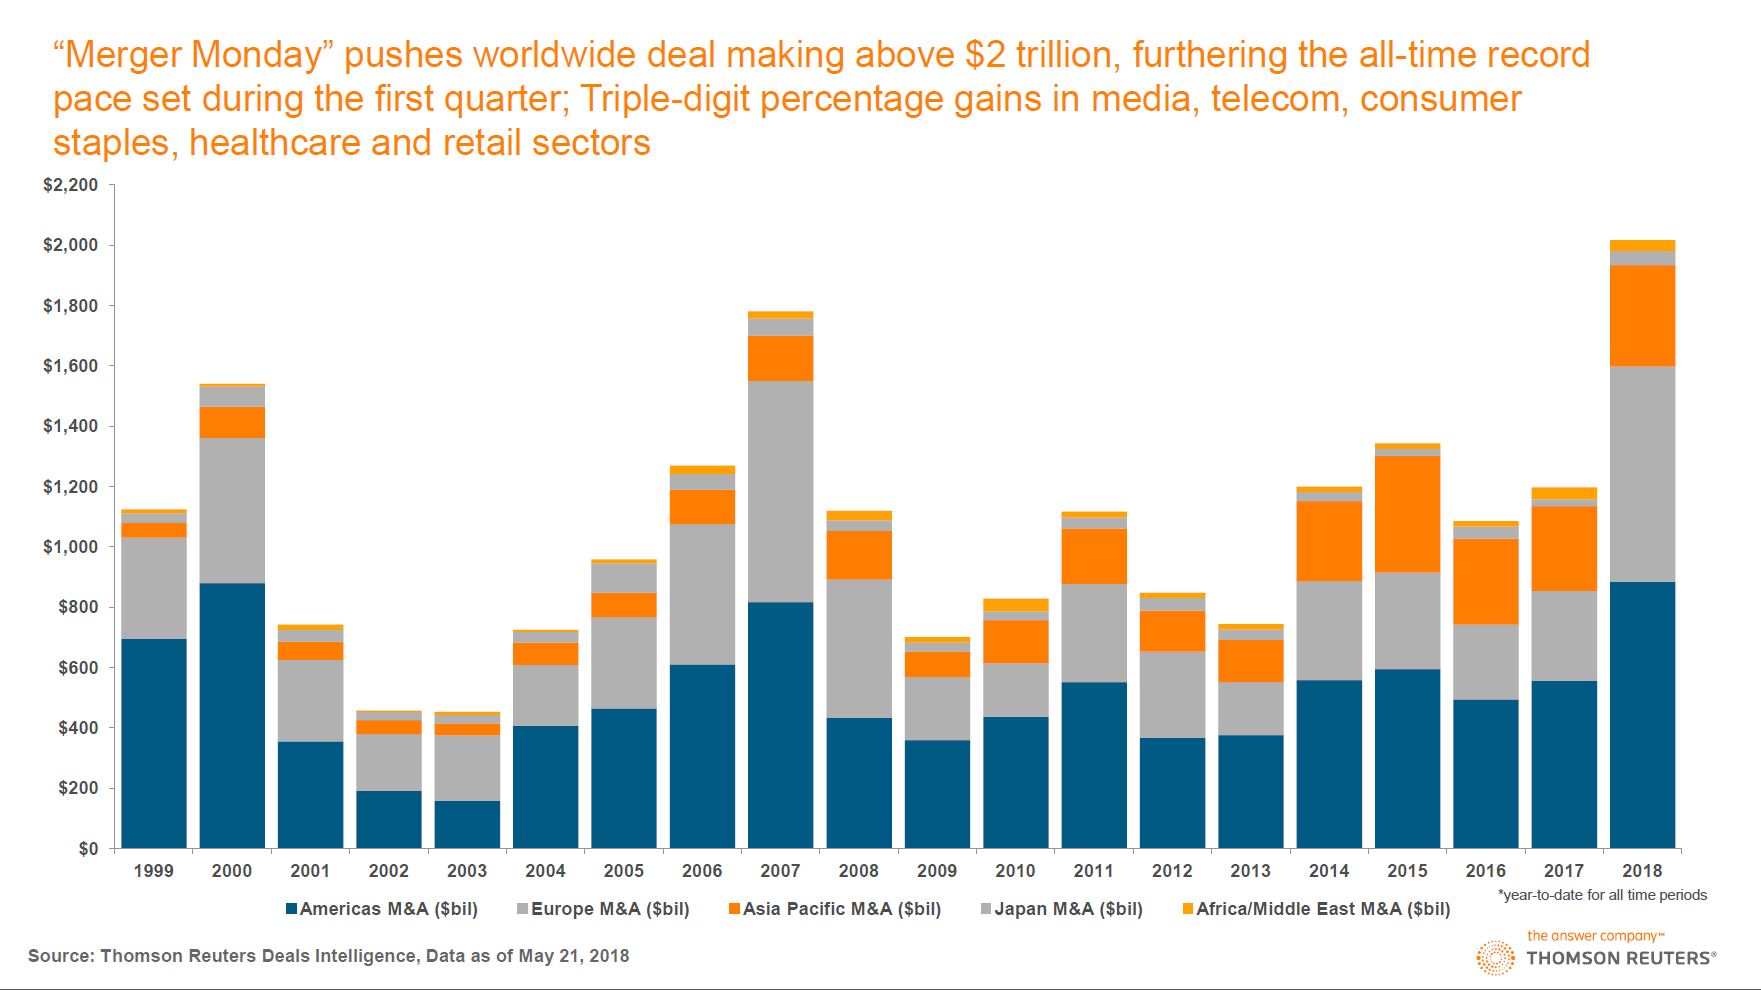
Our friend Jonathan Tepper of research house Variant Perception (check out their blog to see some of their excellent work) recently pointed out to us that the volume of mergers and acquisitions has increased rather noticeably lately. Some color on this was provided in an article published by Reuters in late May, “Global M&A hits record $2 trillion in the year to date”, which inter alia contained the following chart illustrating the situation. This snapshot was taken shortly after a particularly busy “Merger Monday” in May, which saw $28 billion in takeover announcements:

Getting frisky: captains of industry and private equity funds evidently feel supremely confident again and have embarked on a major shopping spree. This mainly goes to show that no-one ever learns a thing in financial markets (presumably this goes for “learning from history” generally, but the remarkable thing in this case are the small time intervals between the markets teaching lessons and the subsequent collective forgetting exercise). The people responsible for all this breathless activity get paid more than at any other time in history, both in nominal and real terms – and one of their major characteristics is apparently that they have the attention span of gnats.
Almost needless to say, this is a nigh perfect medium to long term contrary indicator. When stocks are actually cheap, most of our corporate chieftains behave like deer in the headlights, i.e., they basically freeze and do nothing. The backdrop they prefer to see before they feel compelled to really swing into action full-speed-ahead with maximum recklessness is “one of the most overvalued markets in history”. Only then do they feel truly safe.
Luckily for the rest of us this bizarre herding behavior provides us with quite a useful signal. Currently its message is “get out of Dodge while the getting is good”.
Since the chart above was put together, a flurry of additional deals was either consummated or announced. Leaving aside the interesting psychological aspects of this recurring urge to merge at the highest possible prices, there are other reasons to be wary of such large-scale outbreaks of takeoveritis. One of them is debt.
The New Kings of Debt
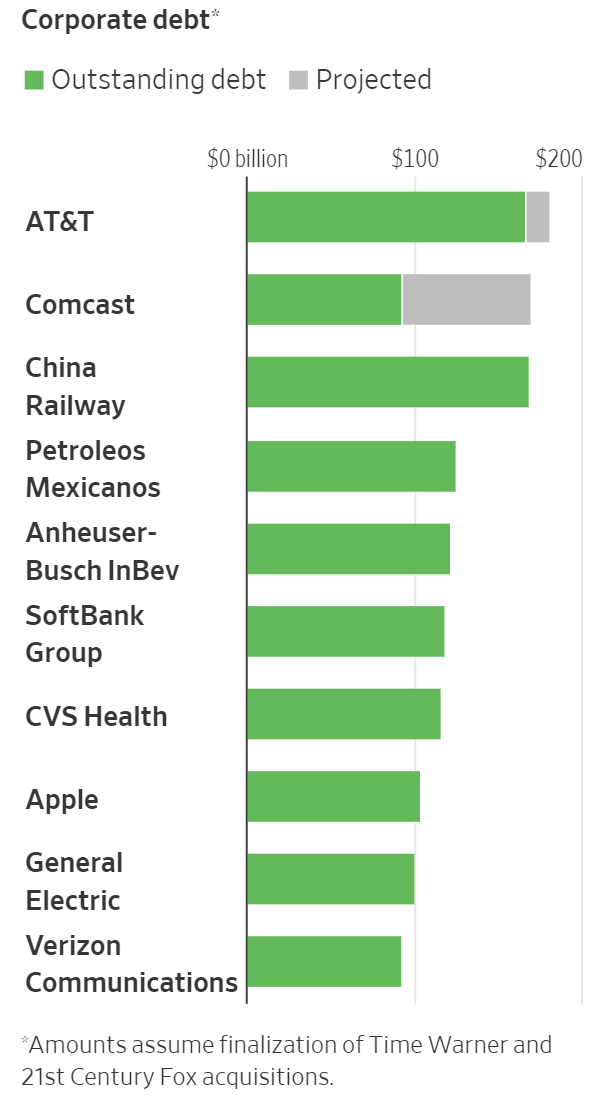
As the WSJ informs us in a recent article on mega-mergers involving old media companies, AT&T (NYSE:T) and Comcast (NASDAQ:CMCSA) will be left with some USD 350 billion in combined debt on their books once their respective deals are finalized, making them the most indebted companies on the planet. AT&T is buying Time Warner – which feels fatally reminiscent of the Time Warner/AOL merger – while Comcast is trying to buy most of Twenty-First Century Fox (NASDAQ:FOX) (Disney (NYSE:DIS) is still in the ring as well, as it wants to get back the currently quite valuable Marvel movie properties held by Fox).

Meet the issuers of the largest corporate debt piles known to man. AT&T and Comcast are about to become the undisputed kings of the hill. It seems exceedingly likely to us that it will turn out in hindsight that their timing was really unimpressive.
The WSJ mentions in passing what is by now a well-known litany of concerns:
“The debt-fueled buyouts by AT&T and Comcast are extreme examples of a decade long surge in corporate borrowing that is stoking investor anxieties about what will happen as the economy slows and global interest rates rise” and
“[…] the median leverage for companies rated investment grade has jumped 30% since the eve of the financial crisis in 2007, according to Moody’s research. Most companies issue new loans and bonds to repay debt, and investors are concerned about how companies will refinance their record-breaking debt loads when capital markets experience their next significant downturn.”
However, supposedly these stalwarts are doing so well that there is nothing to worry about after all. Below we have highlighted assorted bromides cited in the WSJ article:
“Officials at AT&T and Comcast say the refinancing risk from their post-deal debt would be minimal because they plan to quickly repay much of the debt with cash generated from the combined businesses. AT&T, for example, is expected to produce $8 billion to $10 billion of free cash flow—or cash from operations minus capital spending—that could be applied to debt reduction, analysts say. It is also common for telecom companies to carry high debt because they invest heavily in their networks and their customers provide them with reliable revenue.”
“Heavy borrowing by telecom and media companies fueled a surge of defaults in the early part of the last decade by the likes of WorldCom Inc. and Global Crossing, but fund managers said AT&T and Comcast are different because they have vast, profitable businesses to support their debt.
“These are high-quality companies, entrenched players with stable businesses,” says Ed Perks, portfolio manager of a $90 billion stock and bond fund at Franklin Templeton Investments.”
(emphasis added)
To summarize this: they may be drowning in debt after their mergers, but they are entrenched businesses, and this time it’s different – ergo, it’s alright. We would submit that maybe it isn’t. Consider the motives ascribed to the heavy borrowing activities of these companies, which are characterized as “fairly typical” (hardly a comforting thought!):
“Both companies are grappling with slowing growth and increased competition caused by technological change, and they rely heavily on stock dividends and repurchases to satisfy shareholders.” […]
“Many corporations facing similar headwinds responded by raising debt in recent years, an easy choice given low borrowing rates created by ultra-loose central bank policies across the globe.”
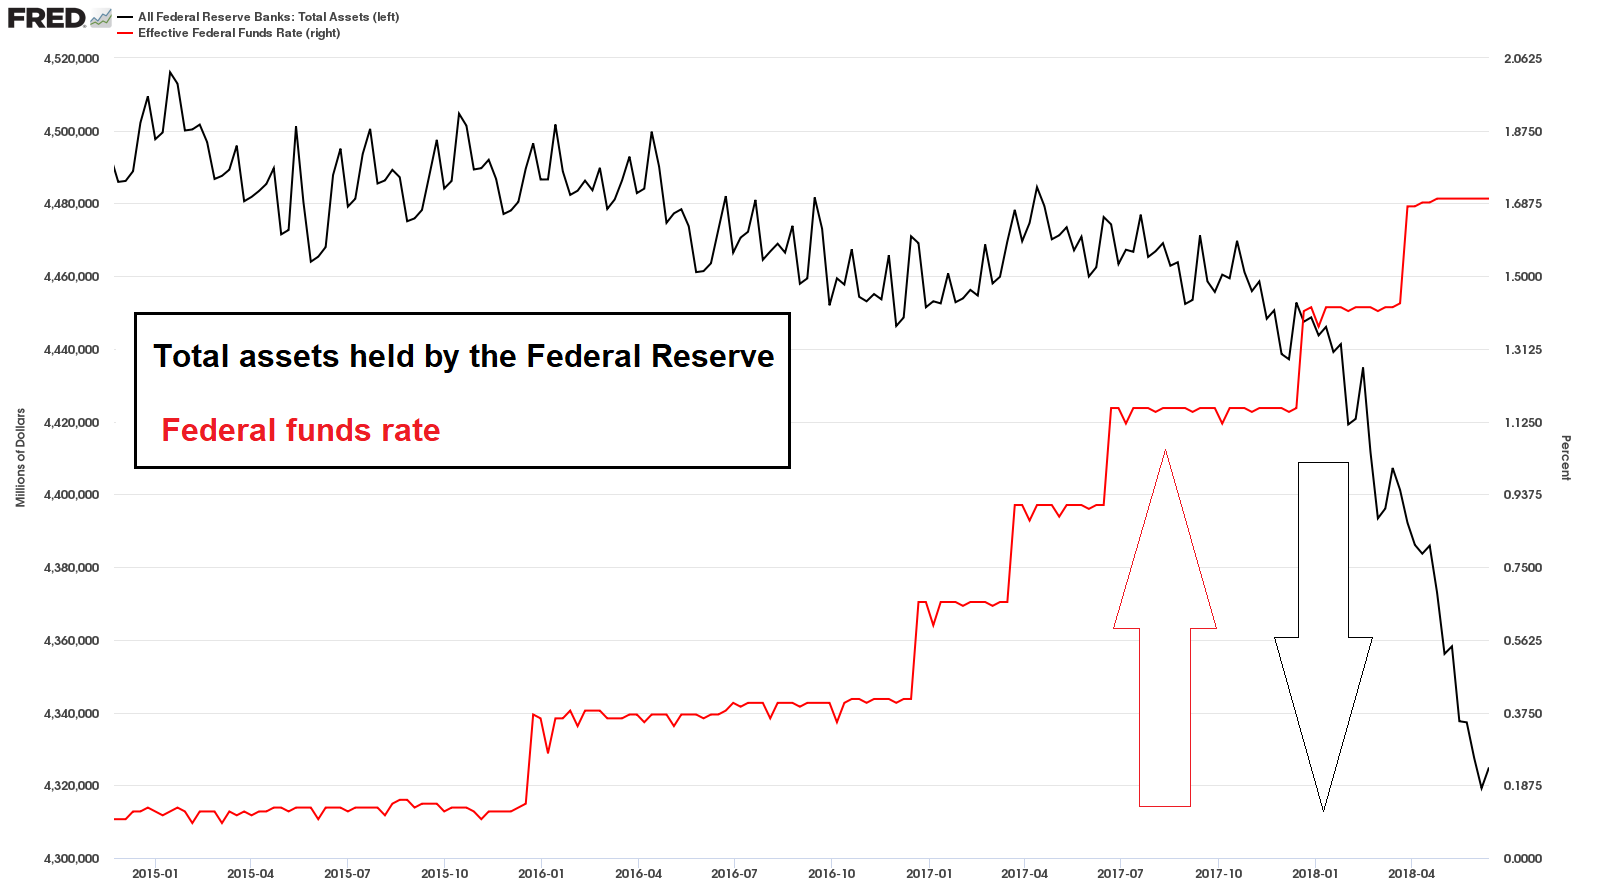
We don’t want to be a wet blanket, but at this particular juncture we should perhaps mention an important recent plot twist: “ultra-loose central bank policies across the globe” increasingly look like yesterday’s story:

Total Fed assets and the federal funds rate: these two data series are decidedly moving in the wrong direction for debtors – especially the biggest ones.
We also happen to think that “grappling with slowing growth and increased competition caused by technological change” may be the worst reason ever to amass previously unheard of levels of debt. Old media companies have more than just a passing problem. The fact that their businesses are “entrenched” is of little moment in a time when consumer habits are undergoing massive change.
We have a strong suspicion that the demographic cohort that provides “reliable income” to old media companies is actually busy dying out. The day only has 24 hours – and anyone who e.g. watches movies on Netflix (NASDAQ:NFLX) or Amazon (NASDAQ:AMZN) or gets news and opinion pieces from independent alt-media sources on You-Tube or similar services will perforce have to cut down on newspaper and TV consumption.
And as the rapid collapse in newspaper advertising revenues demonstrated, established businesses can sometimes go from enjoying “reliable revenues” to getting “zilch” a lot faster than anyone thought possible.
Meanwhile in Divergences Land
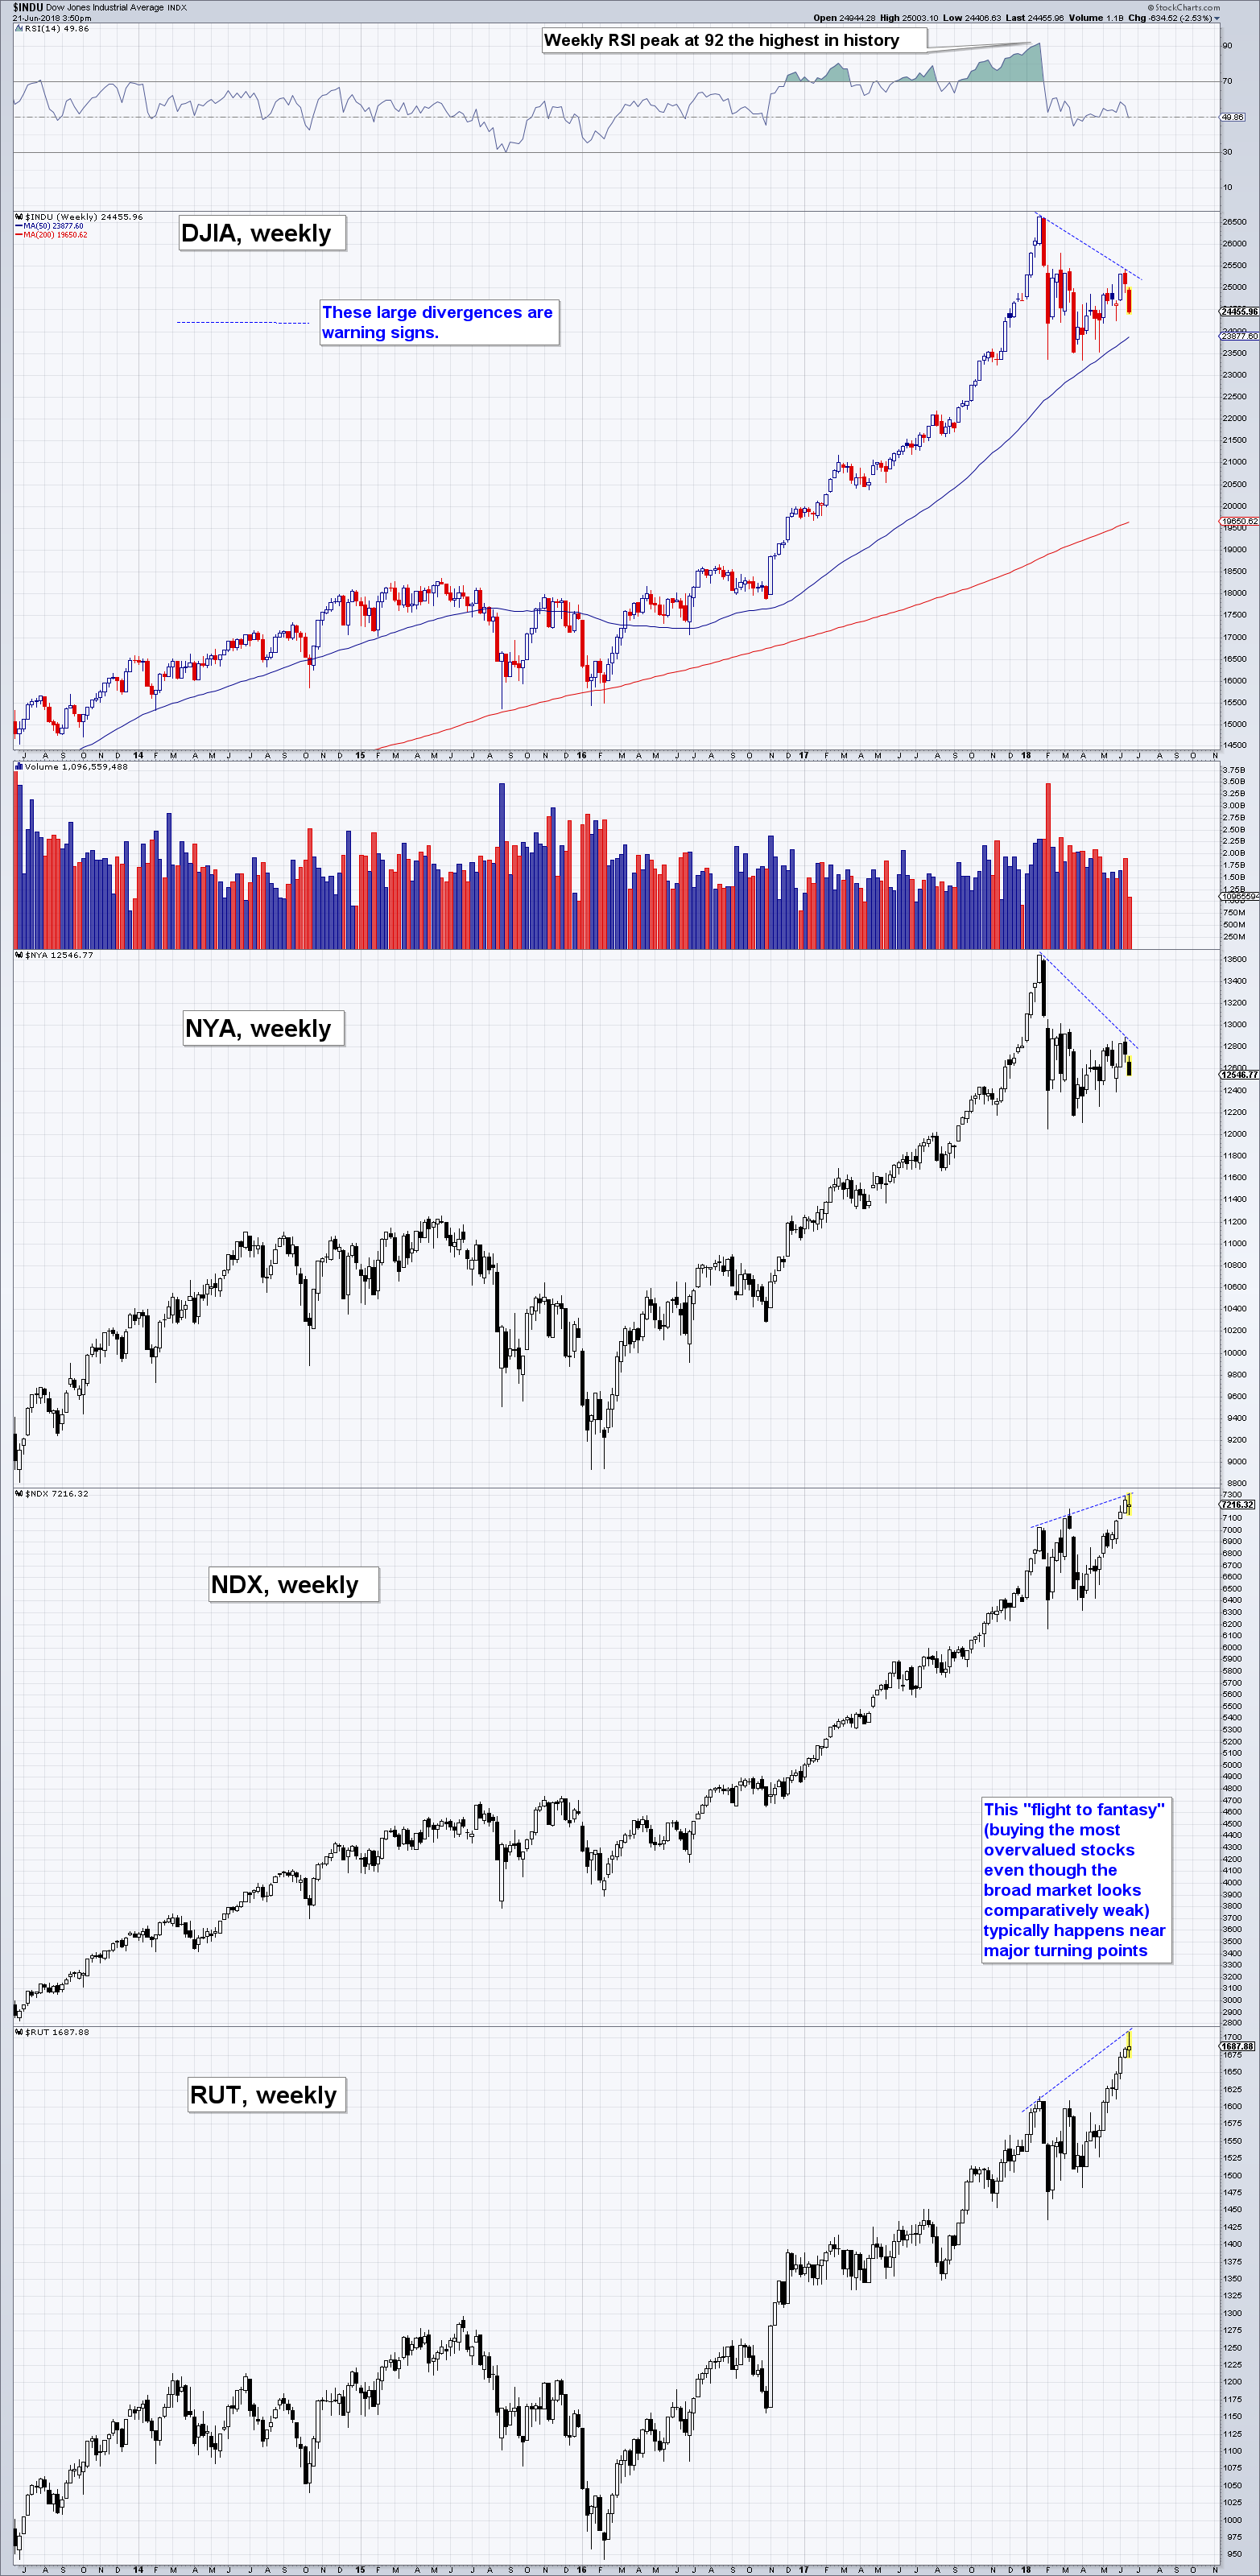
There is another reason to be concerned about the timing of these recent moves to expand outstanding corporate debt even further. The stock market is currently riddled with negative divergences and weak internals. The two charts below illustrate just a few of the most glaring examples.
Dow, NYA, NDX and RUT weekly: large divergences are now in place between these indexes. As we have mentioned on previous occasions, it is fairly typical for the most overvalued and riskiest market sectors to be the last ones to peak as a bull market ages and participation narrows. Divergences can of course always be overcome at a later stage or can become even more extended – but in view of the circumstances, it would surely be a mistake to ignore them.

The new highs/ new lows percent index (as an aside to this: the “Hindenburg omen” which is also a measure of the dispersion of new high and new lows was recently triggered again as well): We have begun to keep a close eye on this measure ever since noticing that it provided one of the few timely technical warning signals prior to the sudden August 2015 mini-crash (the signal consisted of frequent forays below the zero line). Moreover, the largest genuine bull market corrections since the 2009 low were marked by this index declining deeply into “oversold” territory. It has failed to do so in the slump in early February this year, despite a succession of record point declines in Dow/SPX We suspect that this indicates that it has yet to happen – in other words, the process that started with the late January high in Dow NYA and SPX is not over yet. The fact that the rebound in the NH-NL percent index since then was extremely weak lends additional support to this idea.
These are from the only signals suggesting that caution is called for at this time, but we prefer to keep things simple. We should also mention the “but” that goes with these charts: when the Russell 2000 Index (RUT) has outperformed on previous occasions since 2009, it has often proved to be a leading indicator for the broader market. However, this will almost certainly not be the case near medium or long term turning points. Consider for instance the situation in the summer of 2015, when it turned out to be more of a misleading indicator prior to the sharp August sell-off.
Still, we cannot know with certainty how big the lag introduced by the massive QE-driven global money supply expansion of recent years will eventually turn out to be, so the strong RUT performance deserves a modicum of respect in the short term. We personally believe that the extent of the recent divergences is the more important factor, but since we are dealing with probabilities we have to keep an open mind.
Lastly, the market action in recent days certainly feels as though some sort of resolution is close, so we presumably won’t have to wait very long to find out which tendency will prevail.
