Well, that was quite the reversal. My highest profit of the day was pretty much the millisecond that the market opened. It was all downhill from there. A glance at Materials Select Sector SPDR (NYSE:XLB), the Materials ETF, shows that the market is having just a bit of trouble making its mind up.
XLB Chart:
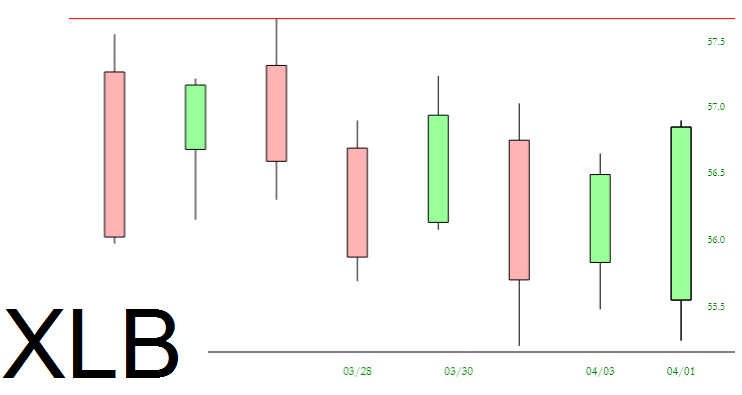
The bulls had two big things in their favor. First, on the whole, the lows of 2/9 didn’t get taken out, and second, the market had come down very far, very fast, recently, leading to an oversold state. We aren’t necessarily out of this oversold state yet, since the price gap is still a fair bit north of present price levels.
iShares S&P 100 (NYSE:OEF) Chart:
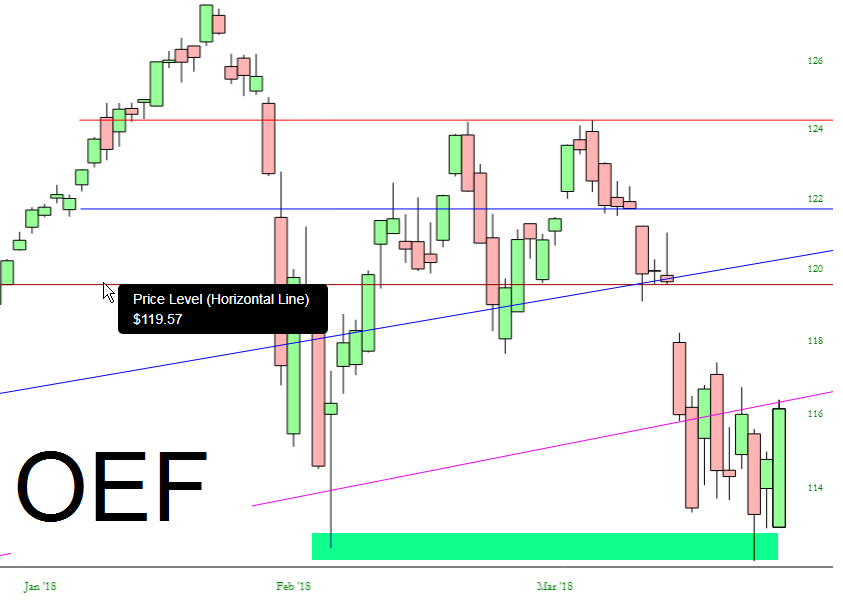
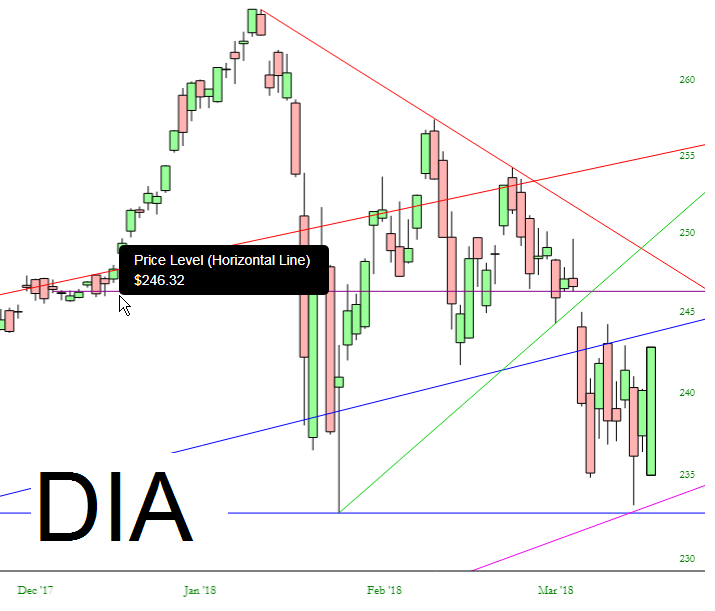
That astonishing bullish engulfing pattern on the Dow Jones Industrials illustrates what a huge reversal this way – – – about 1,000 Dow points within the span of hours.
SPDR Dow Jones Industrial Average (NYSE:DIA) Chart:
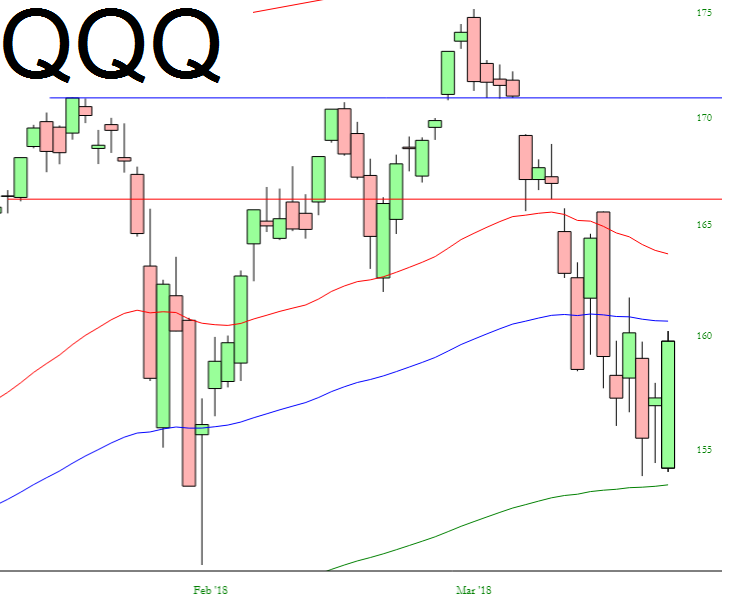
The NASDAQ likewise had a huge bullish engulfing pattern. Notice how interesting it is that the price is banging precisely between the 100 and 200 day exponential moving averages.
PowerShares QQQ Trust Series 1 (NASDAQ:QQQ) Chart:
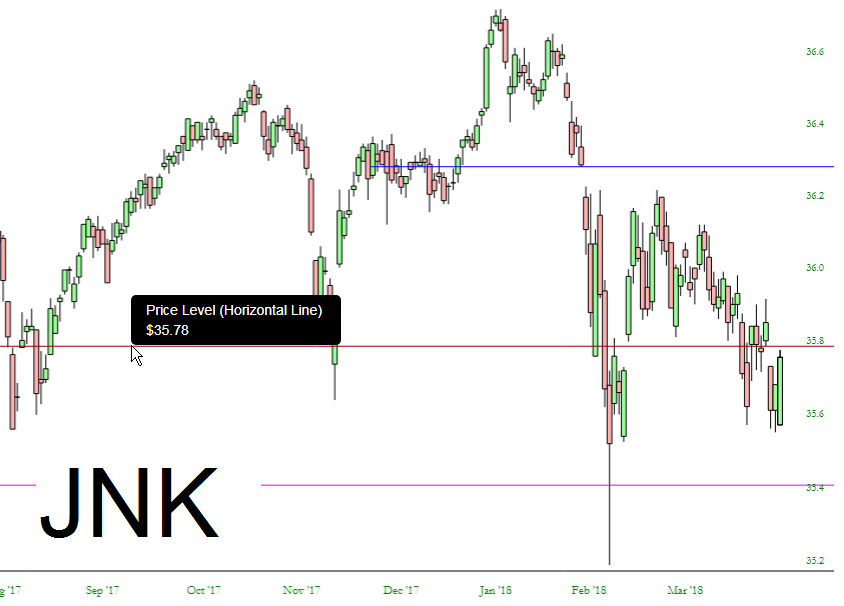
Even the high yield ETFs pushed higher today, although I doubt the likes of JNK are going to go much higher than they already have, given the huge amount of overhead supply.
SPDR Barclays (LON:BARC) High Yield Bond (NYSE:JNK) Chart:
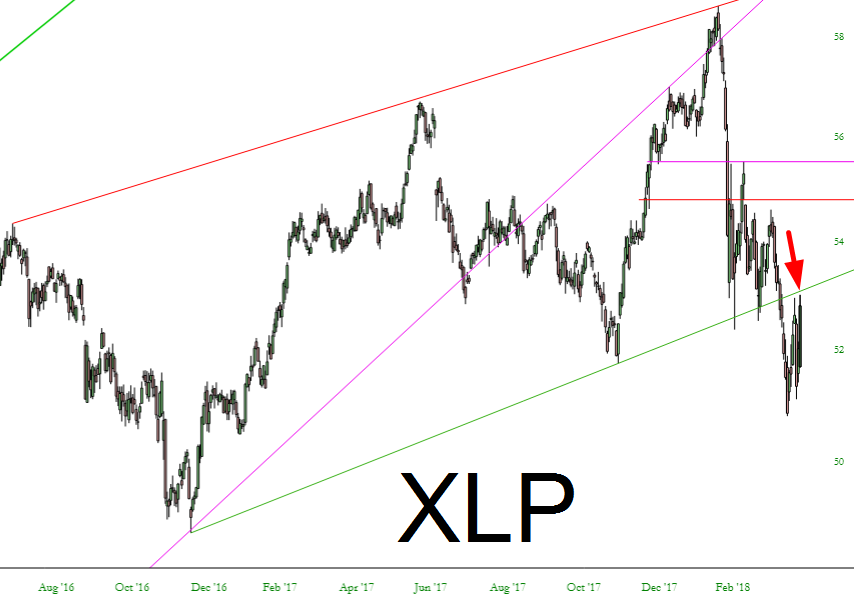
One of the few truly interesting ETF short opportunities is the consumer staples, which is almost touching the lower trendline of its broken channel.
Consumer Staples Select Sector SPDR (NYSE:XLP) Chart:
I got stopped out of plenty of positions, so I’m a lot lighter than I was before. I may have to hunker down and see just how close we get to that price gap, which as I mentioned earlier, is still significantly higher than even today’s peak.
