A spike lower likely lies ahead based on fundamental, as well as developing technical divergences, before a final move to new intermediate-term highs. The latter should be followed by this year’s second leg lower, perhaps to new lows on the Dow as early as the 3rd-quarter. A new 2020 low could discount the worst of forward 12-month EPS growth.
Understanding the fundamental and technical divergences amid manipulated markets helps make sense of the nonsense:
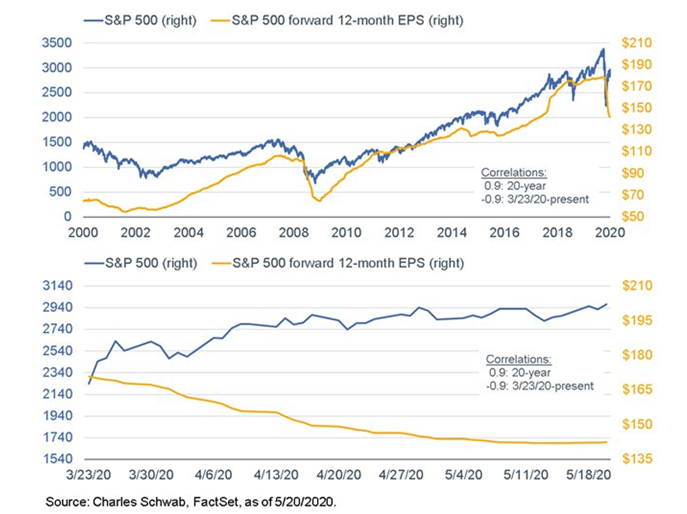
Fundamentally, based on the charts below, we see what may be described as a valuation divergence. According to the Charles Schwab study hereunder, since 2000, the market has had a .9 correlation to forward 12 months EPS. However, since the recent March low, that relationship has tanked to -.9.
A divergence this wide will be removed, perhaps with speed given that the gap was created in just under 3 months.

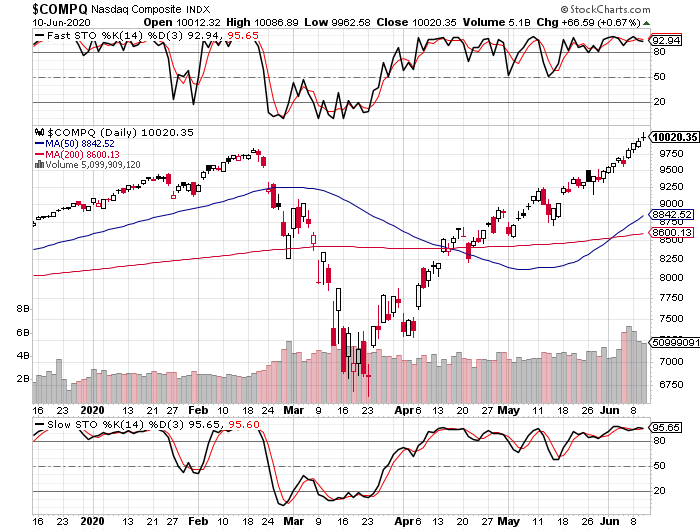
The following 6-month NASDAQ chart reflects a bearish divergence in the slow stochastic (below price chart), versus its pre-February all-time high. A very serious momentum divergence is unfolding in the short term, if the Nasdaq were to quickly reverse from here after having just made its new all time high.
Presently, new Nasdaq highs make no difference to long term trends and momentum indicators. In any event, a quick smash toward 8700 would likely coincide with a Dow hit of ~3,000 points (Dow chart not shown).

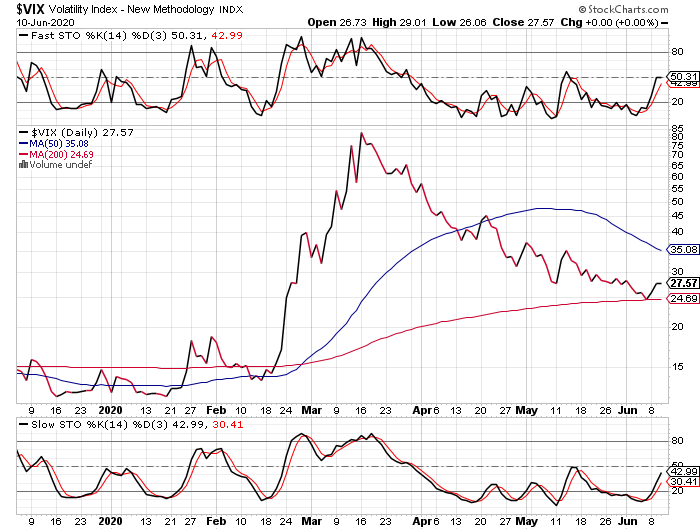
Perhaps, the most compelling indicator is the 6-month VIX chart below.
So as to most clearly illustrate the VIX’s well-defined 5-wave Elliott pattern which had tracked this index to its peak at 85, a line chart is used. This VIX move higher has created a slow stochastic divergence (below price chart) and buy signal by rising back above the 20-level, since the move is accompanied by this divergence. Moreover, this has occurred off of what was almost precisely the VIX’s 200-day moving average, as well.
I noted the bearish divergence in the VIX at its peak in March and, this option premium index, which trends asymmetrically versus the S&P, maybe signaling a short term reversal toward 40. That was the VIX’s approximate level when the slow stochastic had put in its low, a low against which the VIX is presently diverging bullishly.
This could now coincide with a Dow smash of a few thousand points, to get the ball rolling toward a much larger 2nd-half decline.
Sometimes, when multiple stock indices are telling mildly different stories, the VIX can smooth out the noise and index dissent

STRATEGY
From the April 29, 2020 report:
“After the VIX approached its ATH at 90, I wrote that this criteria could perhaps be softened and, with the market hitting today’s peak, I am again sufficiently bearish as to again suggest being less strict about that 27.5 level. (The SPECIAL SECTION offered investors the general recipe for formulating a rules-based strategy, while I shared that my own VIX criteria uses ~ 27.5 for reentry.)”
The April 29 report was incorrect about the next leg starting at that time, but I was also aware that a new leg higher should again prove the efficacy of the Strategy. On April 29, the VIX’s low was 30.54, so I knew that, in the context of these markets, this meant that good prices were available for reinstating the position.
Indeed, the VIX broke 30 only on May 8th, but a properly structured strategy (see SPECIAL SECTION linked above) could only be profitable. While the profits are engineered to be dramatic following a sharp quarterly drop, according to the engineering, the mathematical probabilities of a positive performance are actually higher after an up quarter.
From the March 4, 2020 report:
“To refresh, an appropriate put-combination strategy that is geared for these markets should provide positive results following a positive quarter, while aiming to profit in the 65-95% range after a bear market-style quarterly decline of 8 - 10%.”
CONCLUSION
A top-to-bottom market collapse of 50% might still occur as early as the 3rd quarter. However, throwing investors in this bearish cycle off the scent, and causing losses of their capital and confidence, is just a natural outcome in a Fed-centric and Wall Street-dominated world.
Written June 10, 2020 4:55 PM EST
