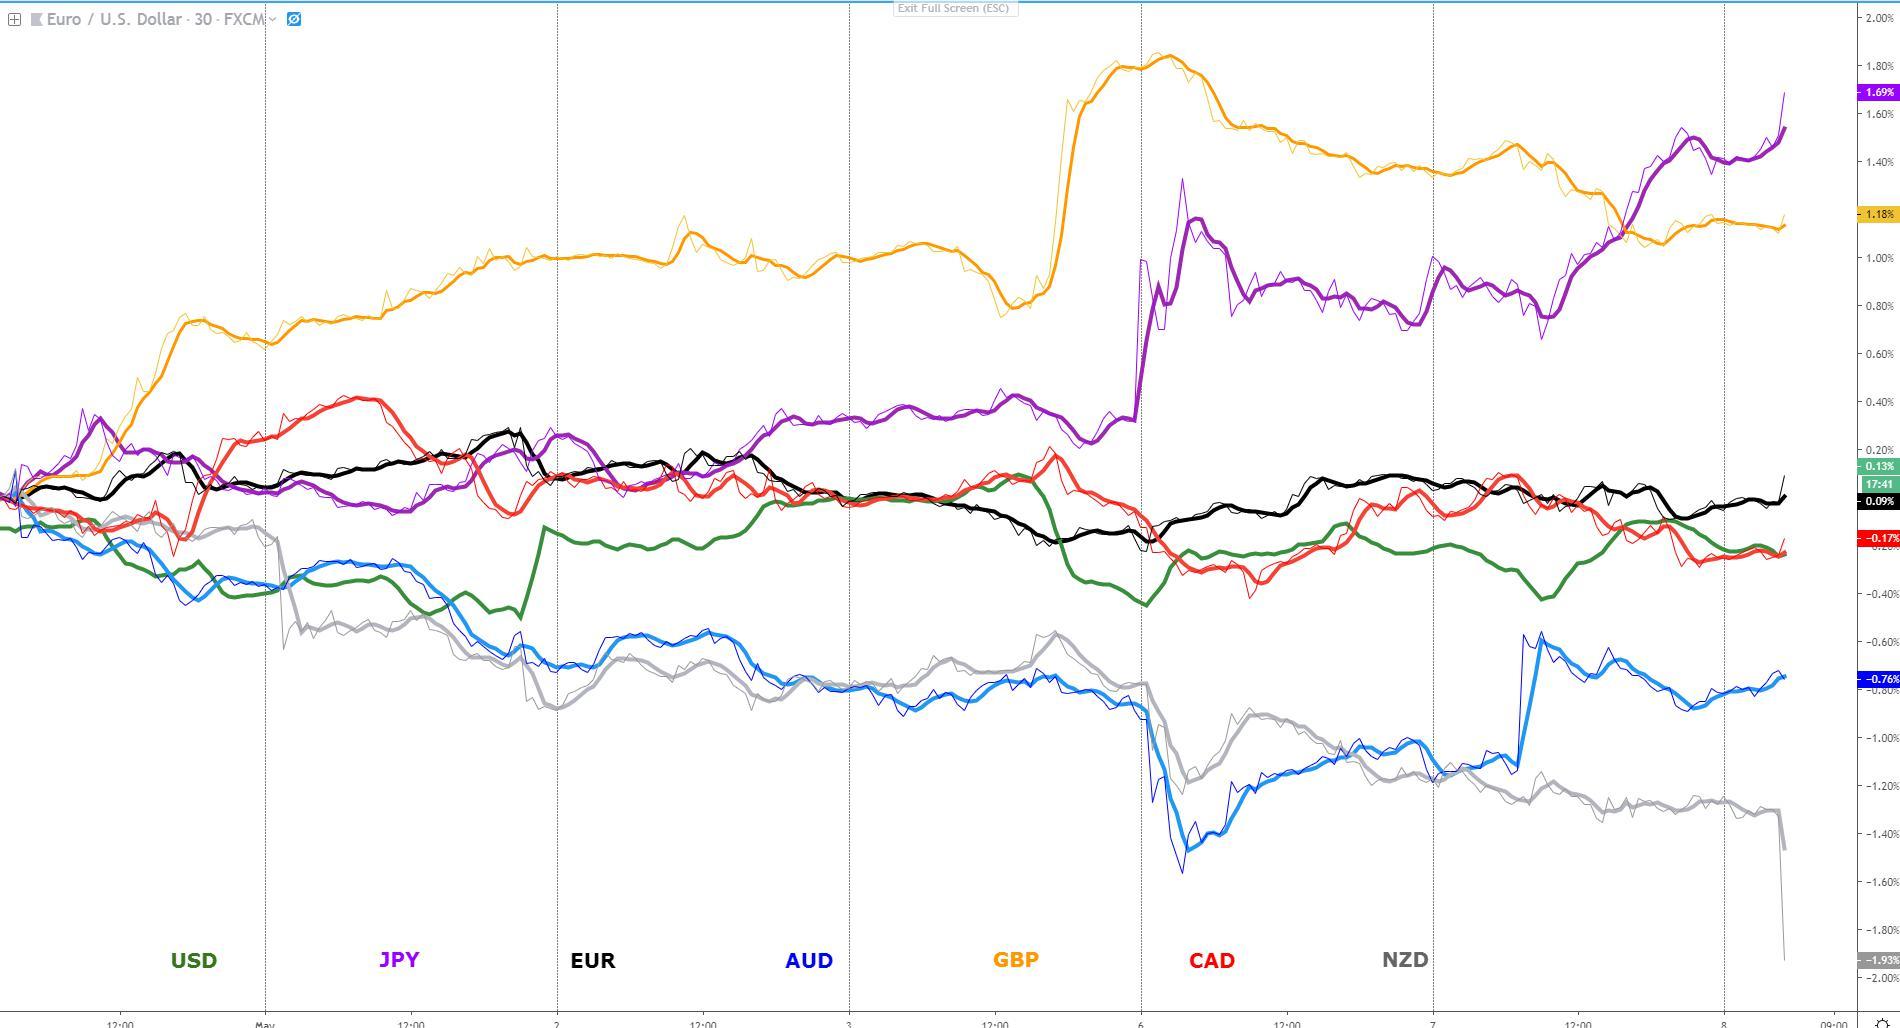
The yen has had no rival this week as the deleveraging in financial markets continues to follow its course at a rapid pace. The psyche of the market has clearly permuted from Trump's tweet just a premeditated tactic to real fears of a no deal or at least a prolonged delay in an eventual agreement. The sizeable loss of value in Chinese equities or the steady depreciation in the Chinese yuan are bad augurs for a market filled with renewed uncertainty over the outlook for global growth if the US hikes tariffs to 25% on $200bn of Chinese imported goods by this Friday.
In the meantime, on the other side of the spectrum, we find the Kiwi, battered by a surprise 25 bp rate cut by the RBNZ, and the sterling, pressured as optimism around a Conservative-Labour agreement on Brexit fades away. The USD is another currency that despite the usual promotion of buy-side flows on the back of a pick up in risk aversion, the unwinding of carry trades as the VIX flies above 20.00 is proving to be a major hindrance to attract enough demand. The Aussie is finding demand, spurred by the decision of the RBA to maintain rates unchanged and failing to express a stronger easing bias yesterday; the currency is still faced with the China trade issues, which put pressure on the yuan, but short-term, the adjustment higher in the AUD is also a fundamental play predicated on the RBA inaction.
Narratives In Financial Markets
This Information is gathered after scanning top publications including the FT, WSJ/Dow Jones, Reuters, Bloomberg, Institutional Bank Research reports.
- ‘True risk off’ extends as manifested via the price dynamics in a range of asset classes, including the VIX spiking through 20.00, the S&P 500 and US yields getting hammered and the yen bought up across the board as US-China trade fears intensify.
- Even if the attendance by top Chinese trade negotiator and Vice Premier Liu He as part of this week’s talks on trade was confirmed by the Chinese Commerce Ministry, the immediate rise in US tariffs to China on $200bn of Chinese imports by 12:01 on Friday keeps spooking the market. Unless China backpedals its reneging stance to renegotiate changing IP and proprietary technology laws, which is the reason infuriating Trump, the stage has been set up for an ugly end should both countries part ways without a deal. A lot to re-price if the case.
- The re-ignition of the market concerns about a blow up in the US-China trade deal came late on Monday US time standards, when Mnuchin and Lighthizer doubled down on their rhetoric towards China, leaving no doubt that Trump’s tweets were not a bluff.
- To make matters worse, China-state owned Xinhua, reported just a few hours ago that the US approach to trade talks is 'regrettable' and that if the US retaliates with further hikes in tariffs, China is not afraid to fight and will do so if necessary. They regret the way Trump has so far managed the standing issues.
- Market sources are reporting that in anticipation of Friday’s tariffs hike by the Trump administration, China is also preparing to hit back with retaliatory tariffs. The next 48h will be absolutely critical to shed some light with volatility set to stay high with a VIX circa 20.00.
- Judging by the performance of Chinese equities, where the Shanghai Composite remains near its trend lows, coupled with a new intraday leg higher in the USD/CNH to retest 6.80, the hints are far from encouraging with the price behavior suggesting investors pessimism reigns.
- The pre-conditions for G10 FX volatility to pick up considerably from here include Central Bank divergence (not yet in place) and risk-off in equities. According to Morgan Stanley (NYSE:MS), the movements seen so far in G10 spot FX have been relatively small based on a 20% VIX index, hence central bank divergence is also required for a large and broad pick-up in FX volatility.
- The Australian dollar fails to sustain its RBA-induced gains after the Central Bank left its rates unchanged at 1.5% and surprisingly not flexing its muscle on the easing outlook. As a consequence, we’ve seen a punchy movement in the front end of the Aussie curve, up by 8bp. Friday’s SoMP by the RBA has tremendous relevance as we’ll get an update on CPI, GDP, jobs, with the consensus pointing towards a downgrade in inflation and growth.
- GBP is struggling to regain momentum as the optimism towards a Conservative-Labour agreement on the Brexit divorce deal iis quickly fading away. According to Bloomberg, the progress in the negotiations have hit an impasse with no easy way out, citing people familiar with the matter. UK PM May is set to face lawmakers in Parliament today.
- In news that should be fundamentally bearish for the price of Oil, RIA reported that Iran and the EU are edging closer to a deal that will allow the former to sell Oil. If the agreement materializes, the US may see it as a provocation, and reinforce fears of US tariffs on EU cars.
- The RBNZ, against most of the expectations placed for today, cut its benchmark rate by 25bp to 1.5% after the Committee announced that consensus of a lower OCR was appropriate, justified by headwinds in spending, growth (both domestic and global) employment.
Recent Economic Indicators And Events Ahead
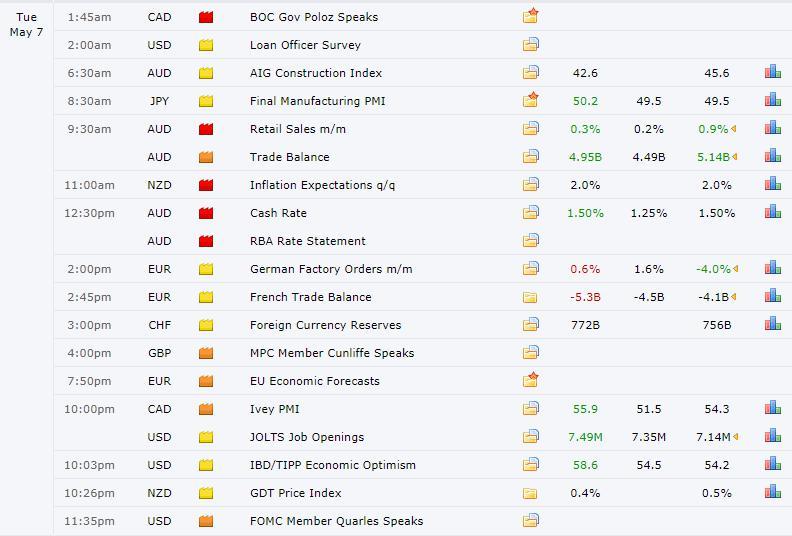
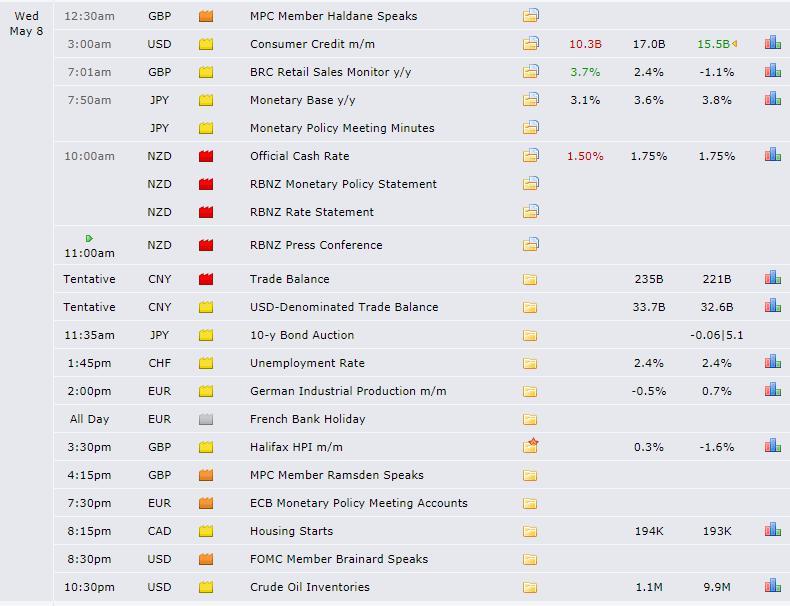
Source: Forexfactory
RORO (Risk On, Risk Off Conditions)
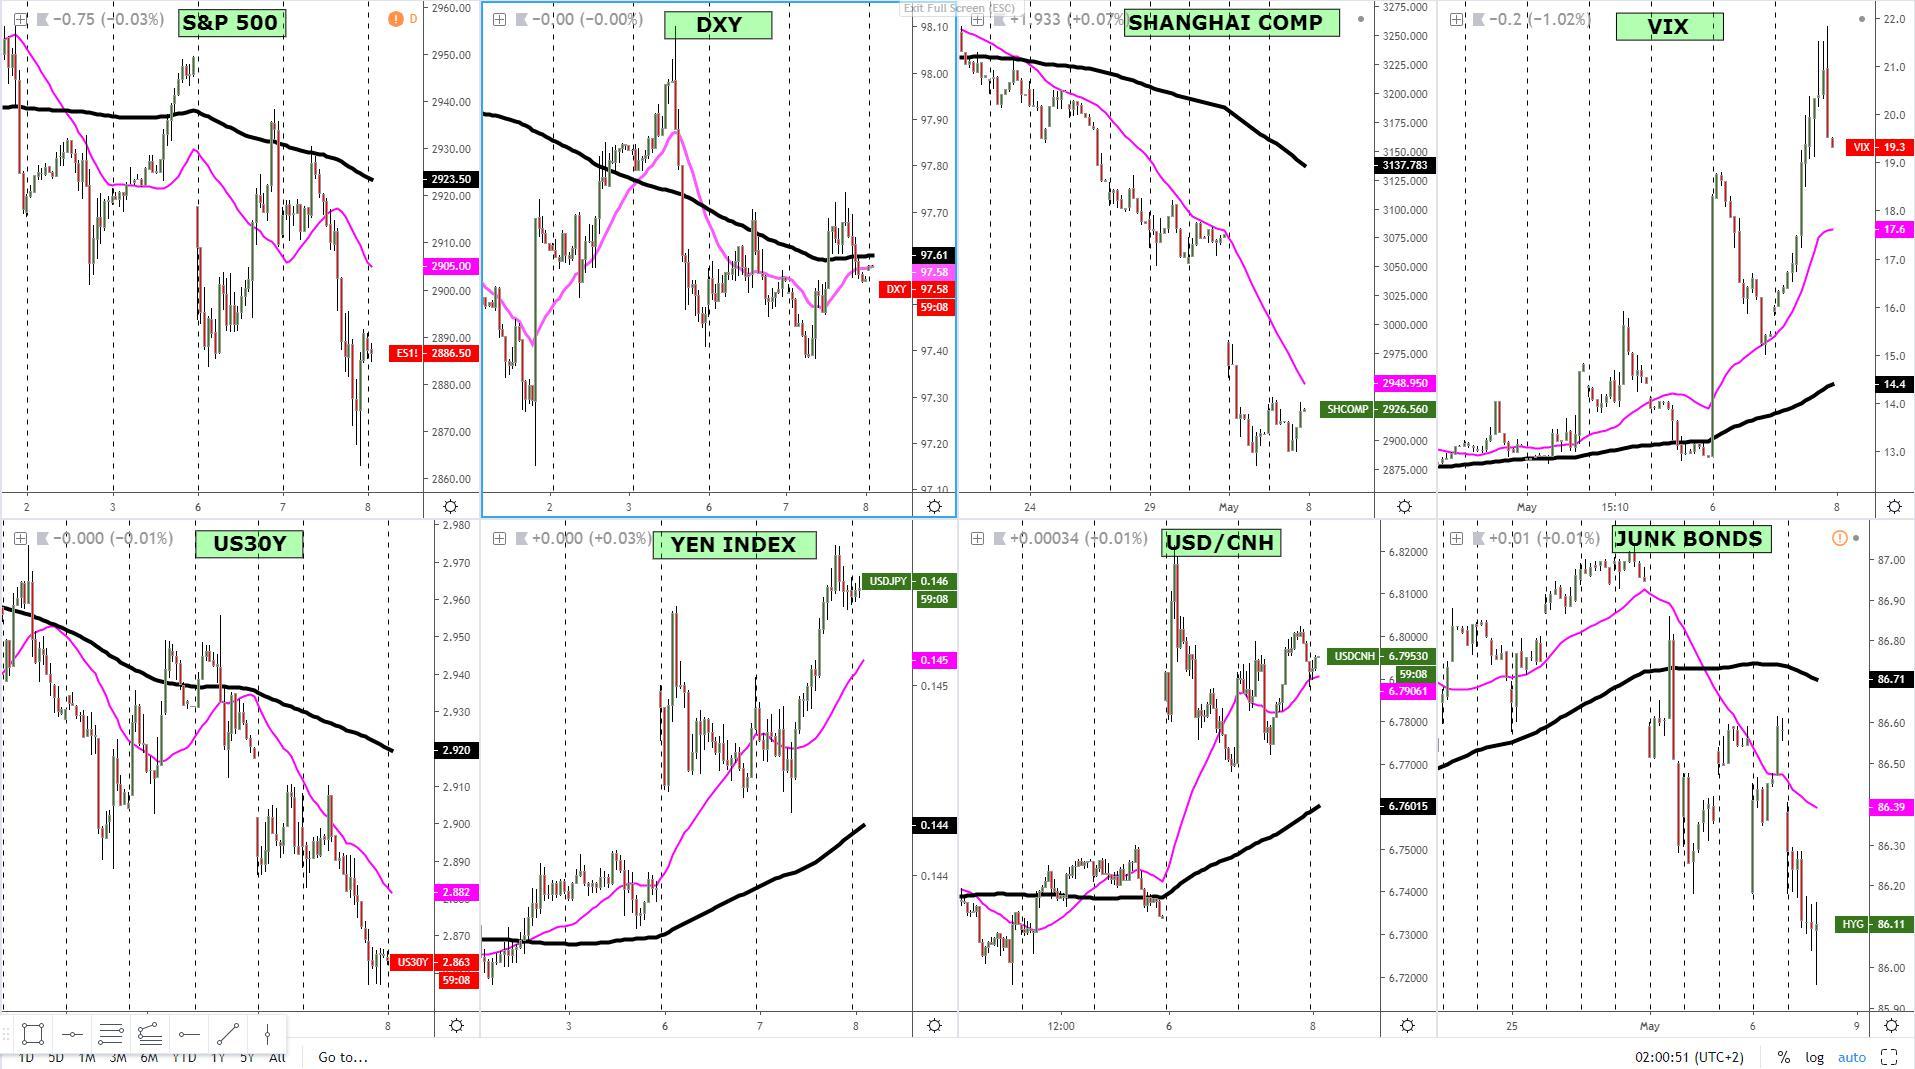
The risk conditions have gone from bad to worse, as portrayed by the dominance of the Japanese yen and to a much lesser extent the DXY, lagging far behind as carry trade strategies unwind fast. In terms of the composition of today's risk profile, we remain deep in a ‘true risk off’ arena, not only characterized by bearish micro and macro trends in equities and yields, as per the slopes of the 25 and 125-HMAs, but the structures have turned unambiguously bearish as new legs lower are found.
In such a rapid pace of deleveraging, one of the dominant strategies in FX amid low vol had been to fund trades via EUR, JPY, CHF and put the money to work on high-yielding currencies the likes of some exotic currencies or the USD, which pays a relatively handsome 2.5%. As market conditions tighten with vol flying high, these positions are forced to be unwound as investors cash out, which leads to DXY selling pressure. This effect is somewhat counterbalanced by the appeal of the currency as a safe-haven.
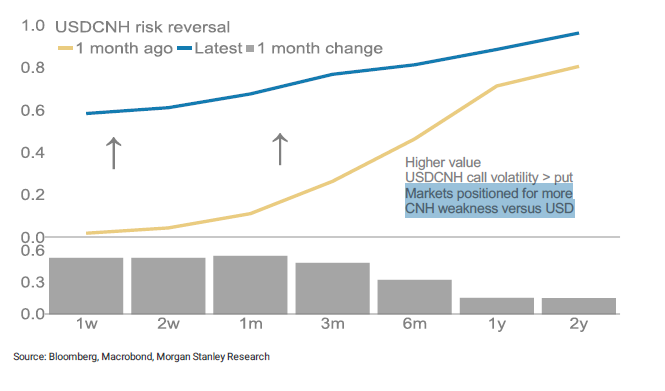
When analyzing the Chinese markets as a barometer of where we stand in the US-China trade negotiations, the augurs are firmly on the negative side as reflected by the consolidation at the lows in the Shanghai Comp and the acceptance of USD/CNH around the 6.8 handle. These two markets are ruling out a friendly resolution in the trade talks short-term. The chart below shows the USD/CNH risk reversals, where CNY bearish expectations have shifted for up to 3 months. Shifting gears to the VIX and junk bonds, the uncertainty is clearly reflected in these asset classes too, with a spike towards 22.00 in the VIX, highest since Jan 22, coupled with a plummeting of high-yielding corp bonds.
Latest Key Developments In G10 FX
As volume picks up and the diversification of capital flows spreads out into the currency market this Wednesday, the Japanese yen is without a doubt the currency promoting the punchiest movements. On the flip side, short the GBP or the NZD, the former a trade just developing after the RBNZ rate cut, have paid handsomely.
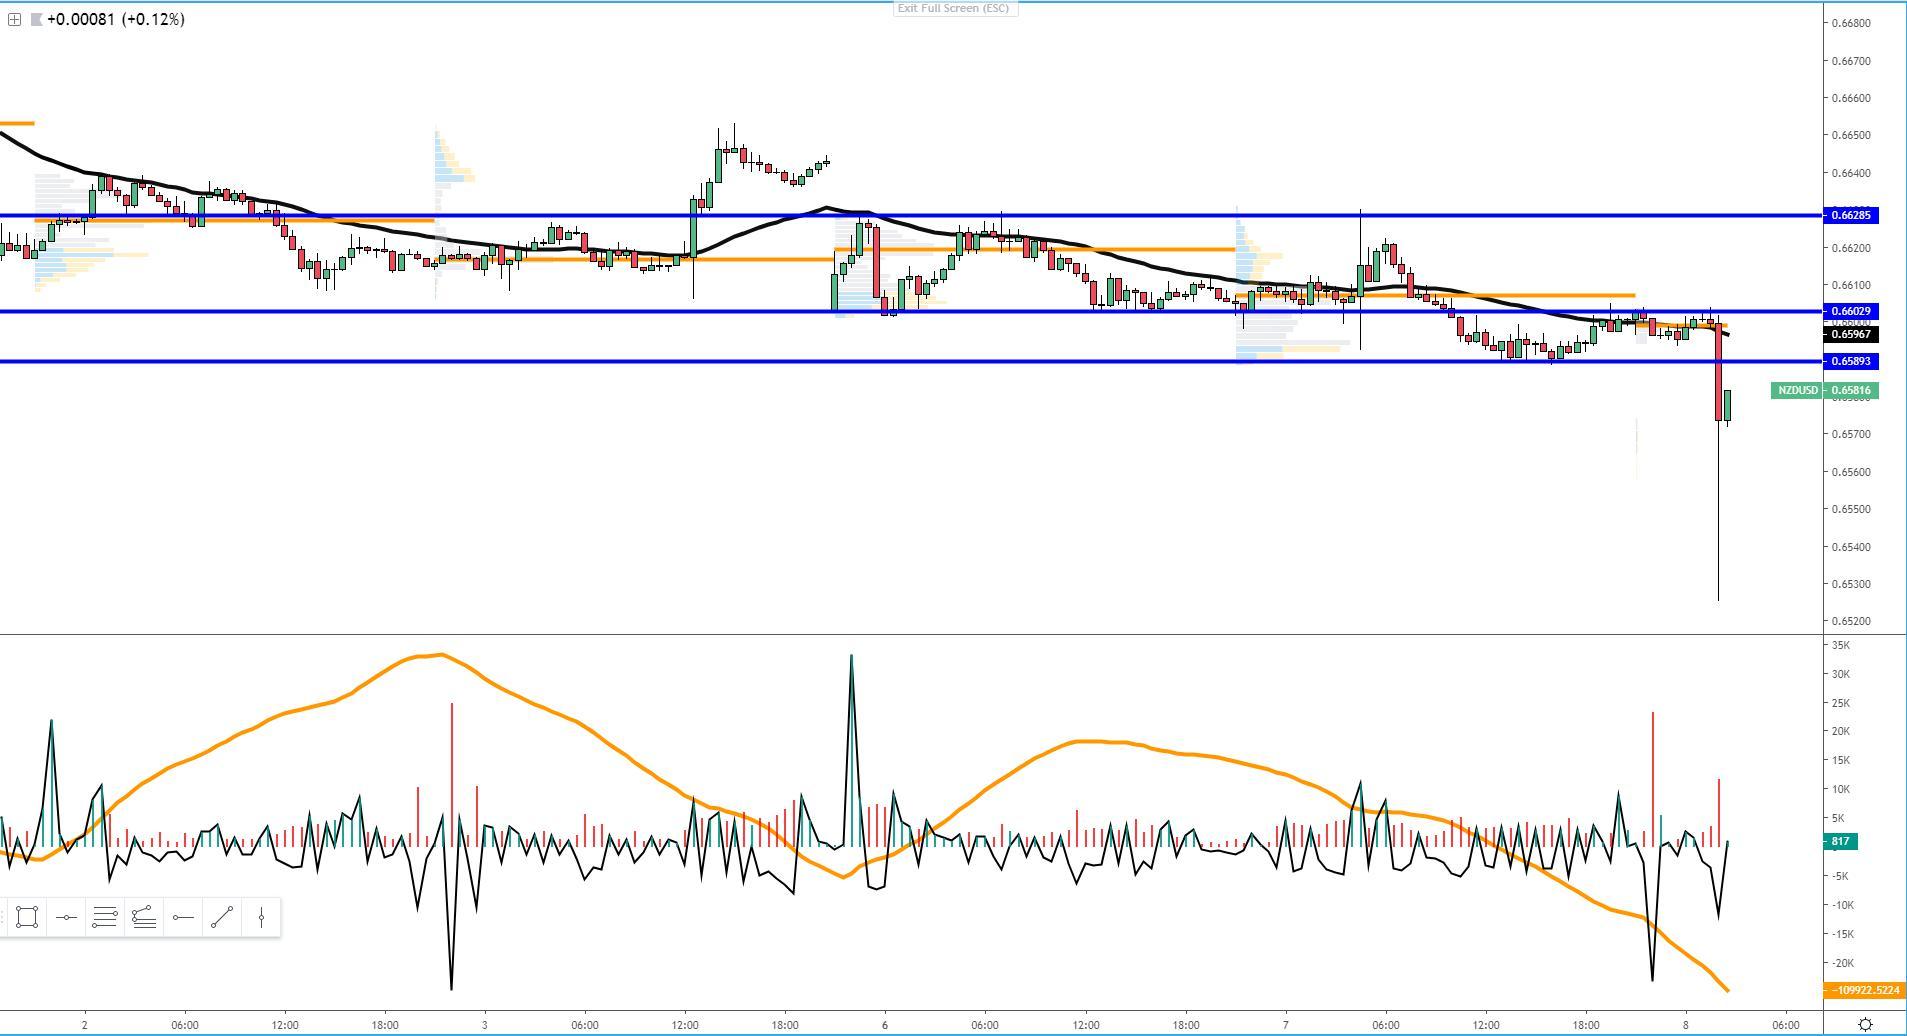
Surprising news indeed by the RBNZ just hit the screens, after the Central Bank cut rates by 25bp to 1.5%, leading to a sharp selloff in the NZD, immediately marked down by over 75p. From a fundamental and technical perspective, while short NZD/USD looks attractive, long AUD/NZD as the readjustment of policy expectations plays out or short NZD/JPY as risk off anchors the yen look set to be interesting propositions on Wednesday. A significant number of opportunities are set to be available intraday.
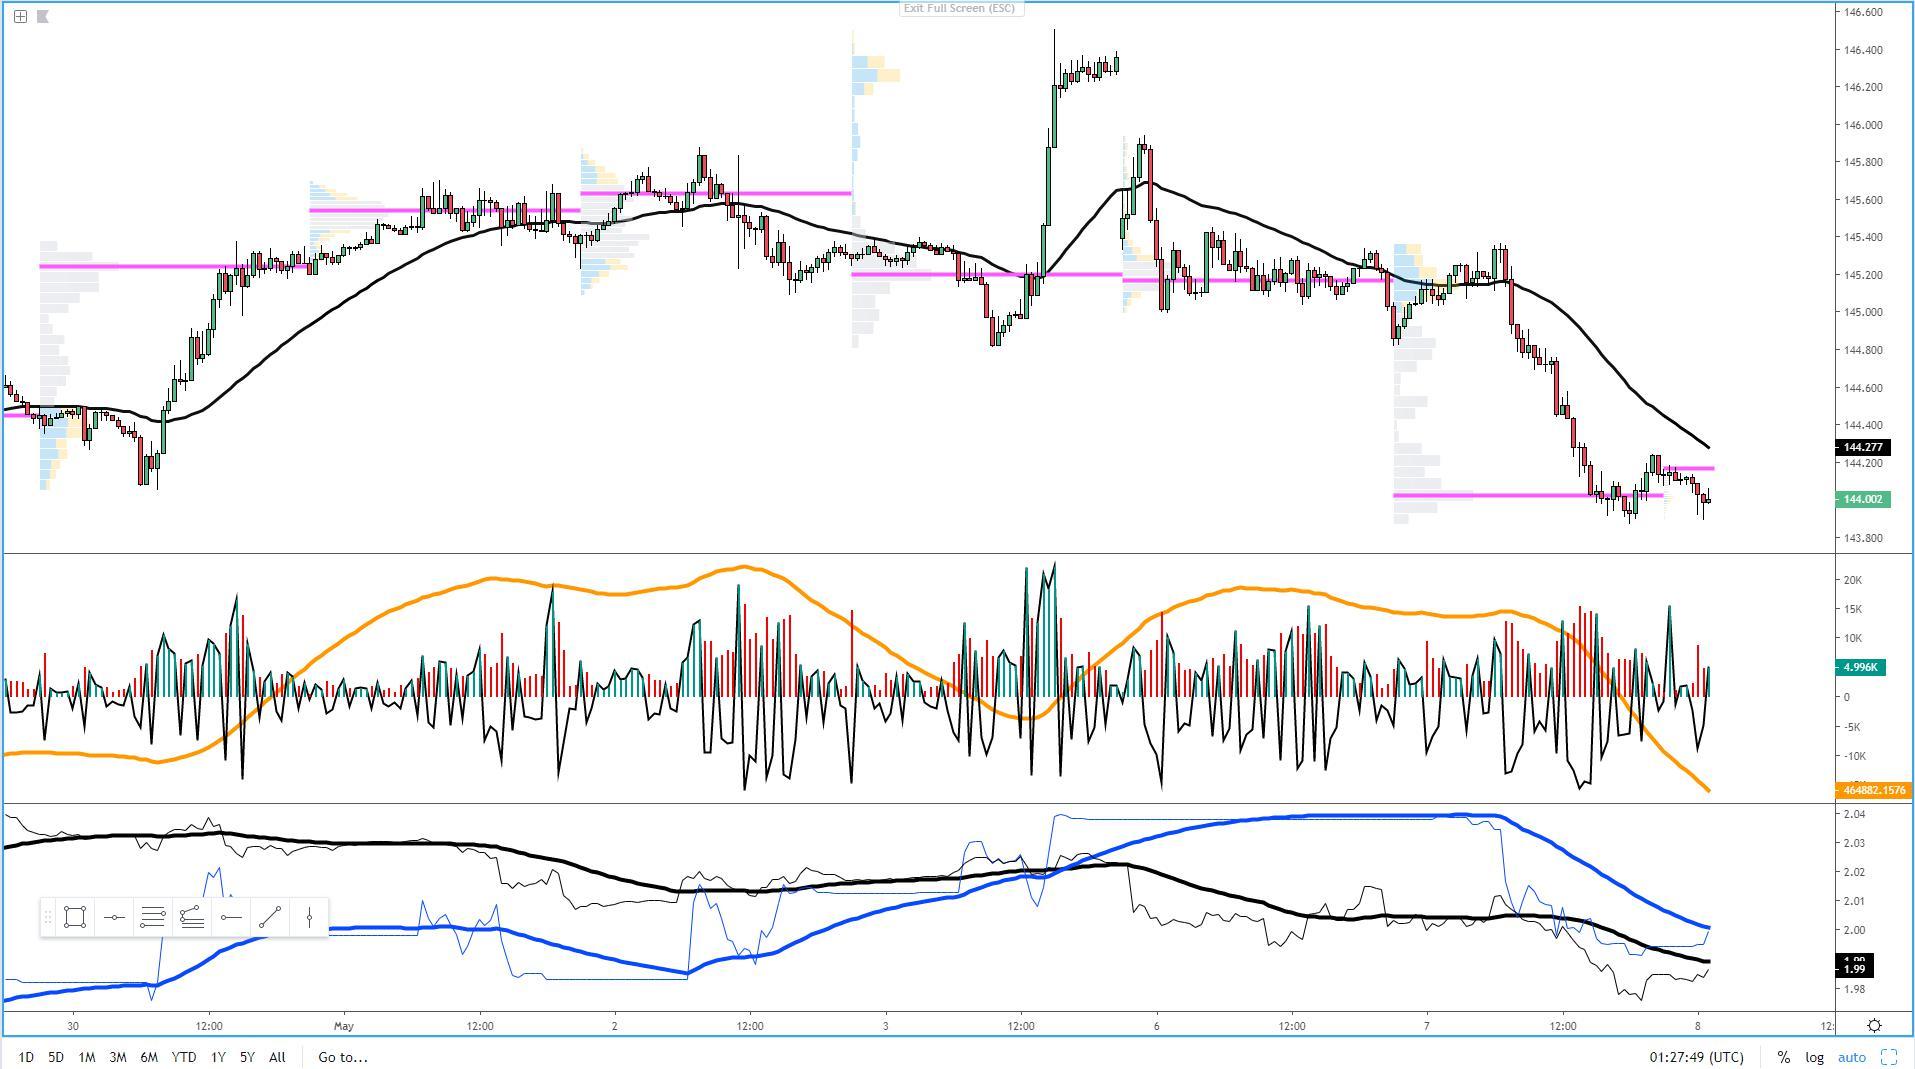
As the chart below shows, short GBP/JPY has been a stellar trade as the Sterling attracts fresh selling interest on the back of fading hopes of a Conservative-Labor Brexit agreement. The diverging FX flows have led to a sizeable 145 pips extension after a relentless selling that started early in the European session and is yet to abate. The build-up of volume at the very lows of the day circa 144.00 after a double distribution down is a reminder that plenty of bids have come through the books to accept as the new equilibrium these lows. To the question, can the momentum extend, the accumulation of volume depicted by the 25-HMA micro trend in thick orange applied to the OBV (On Balance Volume) shows a pronounced bearish slope, which suggests the risk of the bearish bias to extent. Additionally, both the micro trend via the slope of the UK-JP yield spread in thick blue line and the risk line in thick black line endorse shorts.
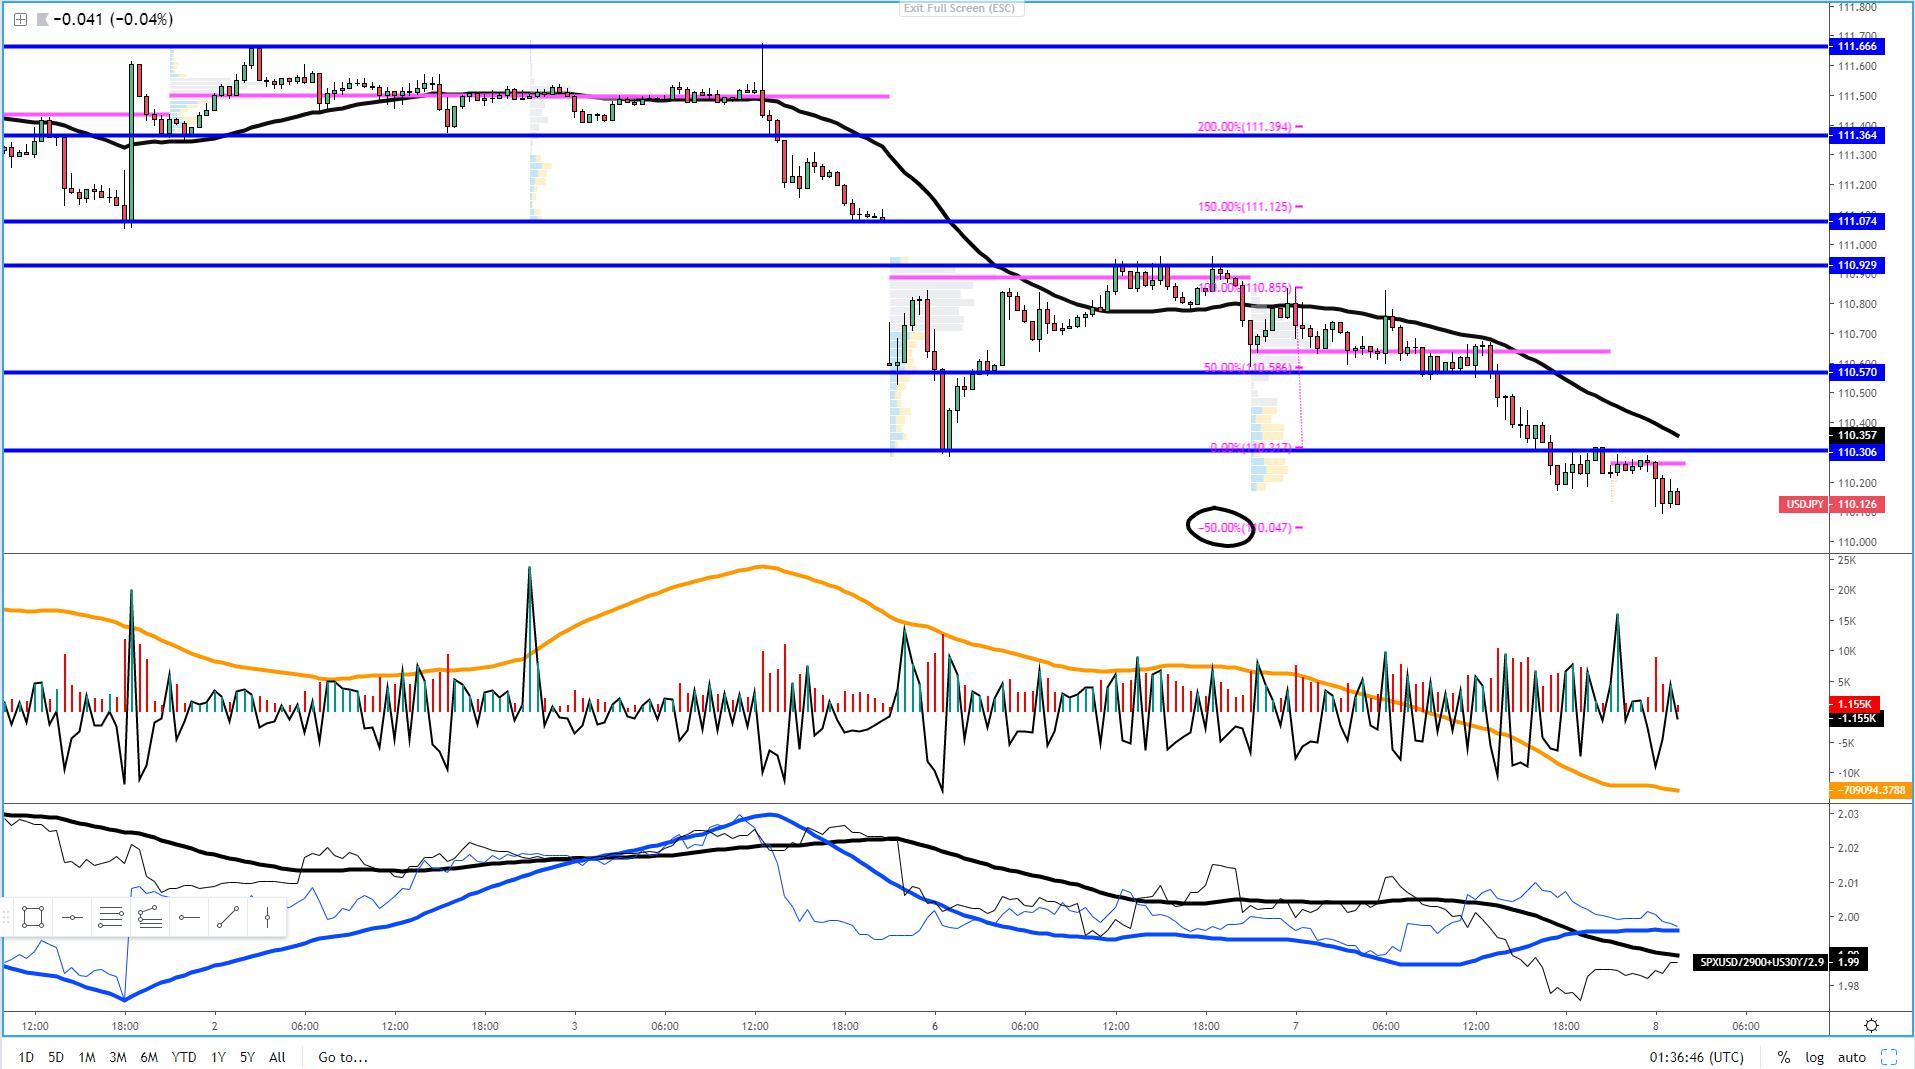
Another market that looks poised to stay pressure, conditioned to US-China trade headlines, is the exchange rate that reflects the valuation of US dollars vs Japanese yens. Not only the volume profile has printed a triple distribution down with the POC trapped on the topside, but the micro trend via the slope of the OBV in orange think line manifests the build-up of selling pressure is still intact. Furthermore, the DXY micro trend is rolling over towards the bearish side at a time when the micro trend in the market risk profile, as depicted by the black thick line, is firmly bearish. That’s always going to be the most toxic combination that contrarian longs can face. Besides, the micro trend derived from price action sees the 25-HMA with congruence, which is further confirmation. We really need to see a major turnaround in sentiment emanating from upcoming US-China trade talks for the exchange rate to show some signs of life again, otherwise, a crack at 110.00 is imminent.
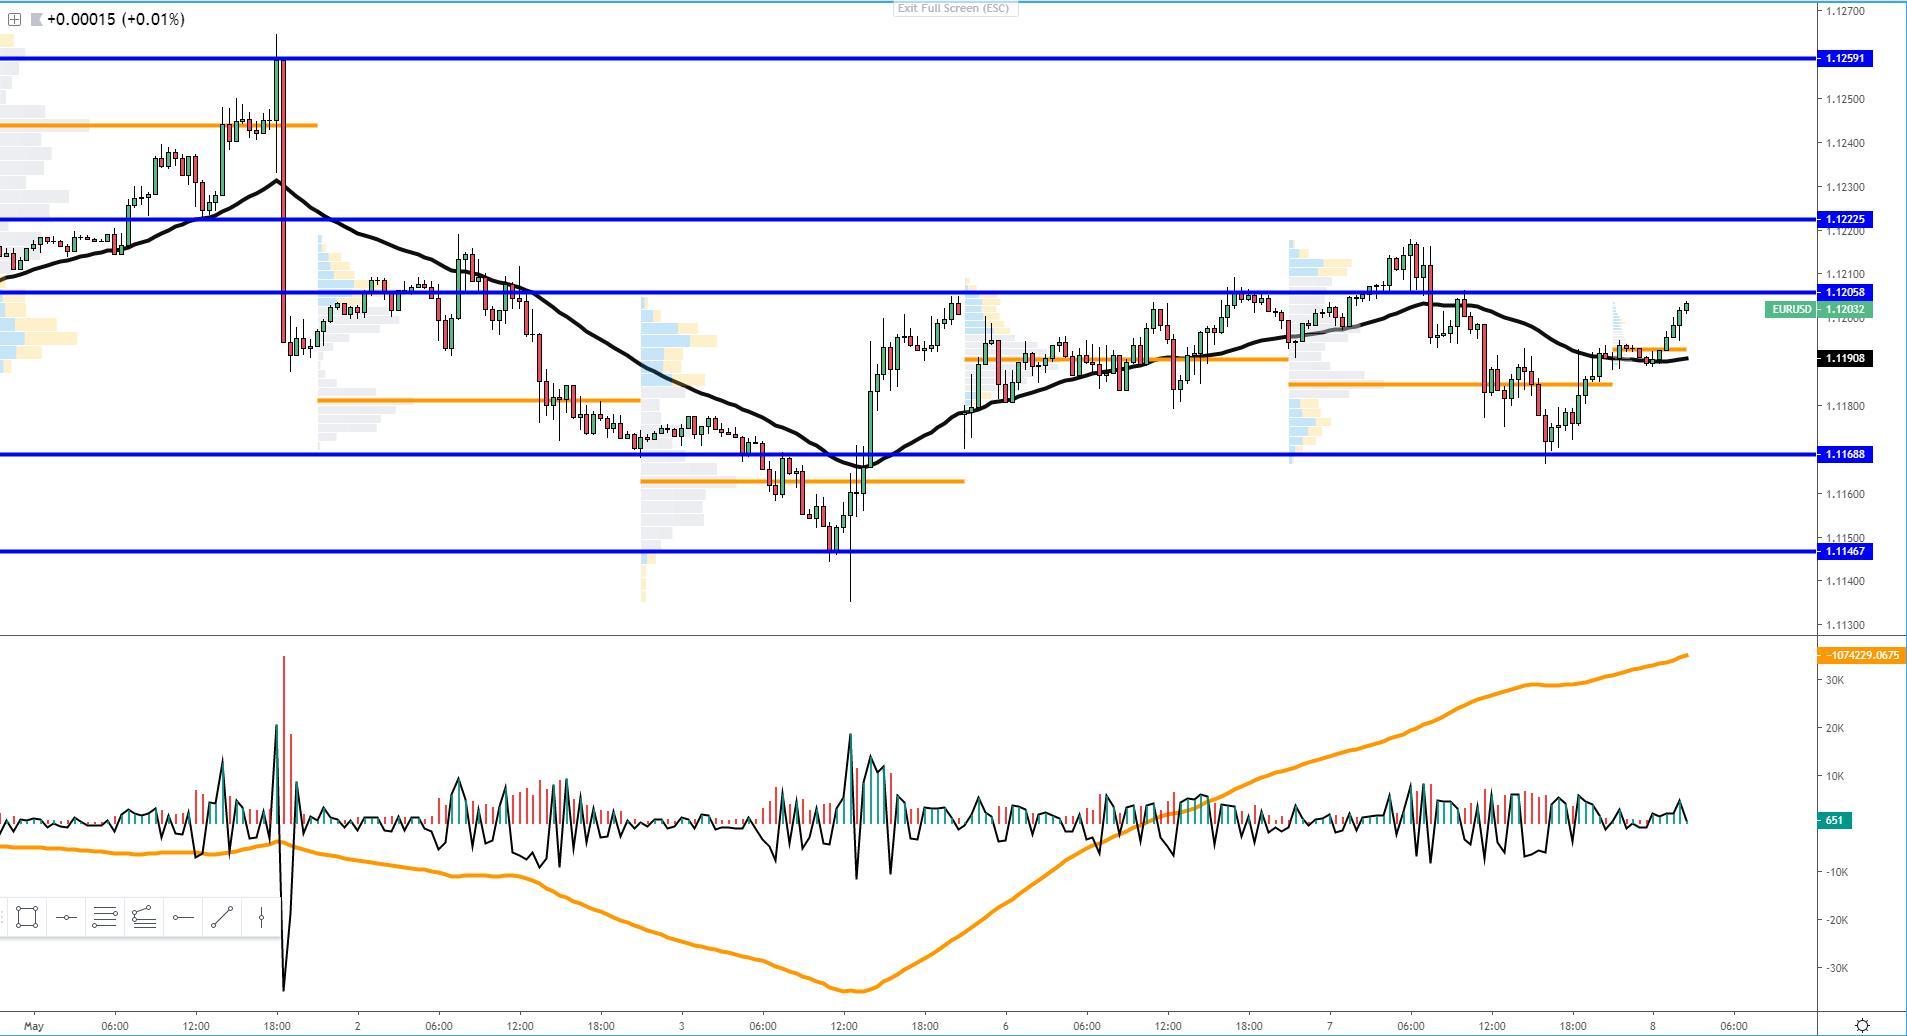
Shifting gears to the euro, the recovery above the 25-HMA derived off price action, alongside the bullish micro-trend in the OBV (build-up of buy-side volume pressure), is a sign that the tide is turning steadily against the US dollar heading into Wednesday. The exchange rate has managed to find a new leg up as weak-handed players have shifted to be the sellers. The volume profile printed on Tuesday is a warning signal as, despite the bearish run, sellers failed to close below the POC. Under this environment, low volume taps followed by new initiated buying looks set to be a dominant strategy, subject to the OBV and the price maintaining the correct bullish structures and slopes. The next target rich in liquidity should be found at 1.12-1205 just overhead, followed by 1.1220-25.
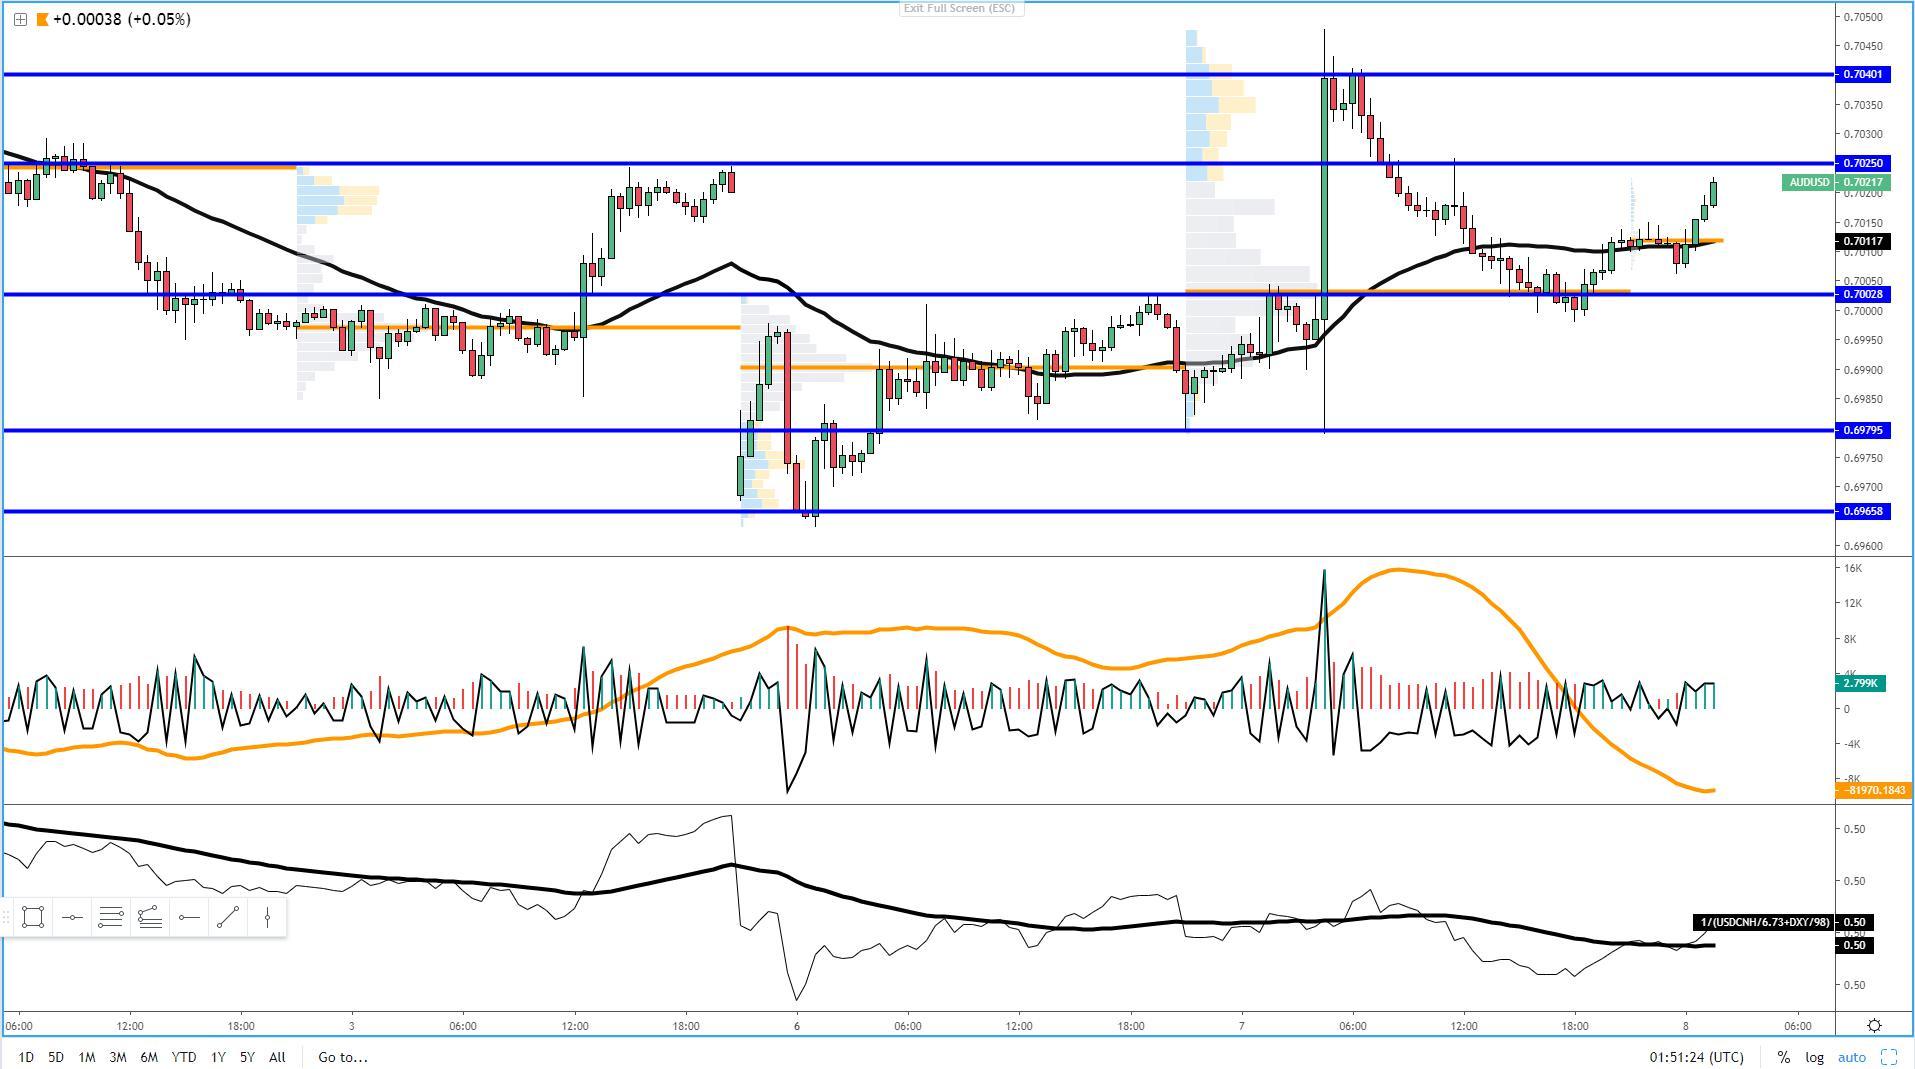
Another currency that is set up to exploit the potential weakness in the USD, especially after the strong adjustment in the front end of the Australian yield curve, up 8bp, is the AUD. The market is still in a transition to re-adjust the AUD valuation on the premise that the RBA did shy away from expressing a stronger easing bias, something the market had anticipated. The recovery of the exchange rate through the 25-HMA is about to get the backing of a turn in the micro trend in the OBV, which essentially gives us an indication of buy/sell volume pressure. If one combines these positive developments with a higher value line as depicted by the inversion of USD/CNH and DXY, paired with a positive price structure and the POC trapped underneath the close, it suggests a buy-side bias.
Important Footnotes
- Risk model: The fact that financial markets have become so intertwined and dynamic makes it essential to stay constantly in tune with market conditions and adapt to new environments. This prop model will assist you to gauge the context that you are trading so that you can significantly reduce the downside risks. To understand the principles applied in the assessment of this model, refer to the tutorial How to Unpack Risk Sentiment Profiles
- Cycles: Markets evolve in cycles followed by a period of distribution and/or accumulation. The weekly cycles are highlighted in red, blue refers to the daily, while the black lines represent the hourly cycles. To understand the principles applied in the assessment of cycles, refer to the tutorial How To Read Market Structures In Forex
- POC: It refers to the point of control. It represents the areas of most interest by trading volume and should act as walls of bids/offers that may result in price reversals. The volume profile analysis tracks trading activity over a specified time period at specified price levels. The study reveals the constant evolution of the market auction process. If you wish to find out more about the importance of the POC, refer to the tutorial How to Read Volume Profile Structures
- Tick Volume: Price updates activity provides great insights into the actual buy or sell-side commitment to be engaged into a specific directional movement. Studies validate that price updates (tick volume) are highly correlated to actual traded volume, with the correlation being very high, when looking at hourly data. If you wish to find out more about the importance tick volume, refer to the tutorial on Why Is Tick Volume Important To Monitor?
- Horizontal Support/Resistance: Unlike levels of dynamic support or resistance or more subjective measurements such as fibonacci retracements, pivot points, trendlines, or other forms of reactive areas, the horizontal lines of support and resistance are universal concepts used by the majority of market participants. It, therefore, makes the areas the most widely followed and relevant to monitor. The Ultimate Guide To Identify Areas Of High Interest In Any Market
- Trendlines: Besides the horizontal lines, trendlines are helpful as a visual representation of the trend. The trendlines are drawn respecting a series of rules that determine the validation of a new cycle being created. Therefore, these trendline drawn in the chart hinge to a certain interpretation of market structures.
- Correlations: Each forex pair has a series of highly correlated assets to assess valuations. This type of study is called inter-market analysis and it involves scoping out anomalies in the ever-evolving global interconnectivity between equities, bonds, currencies, and commodities. If you would like to understand more about this concept, refer to the tutorial How Divergence In Correlated Assets Can Help You Add An Edge.
- Fundamentals: It’s important to highlight that the daily market outlook provided in this report is subject to the impact of the fundamental news. Any unexpected news may cause the price to behave erratically in the short term.
- Projection Targets: The usefulness of the 100% projection resides in the symmetry and harmonic relationships of market cycles. By drawing a 100% projection, you can anticipate the area in the chart where some type of pause and potential reversals in price is likely to occur, due to 1. The side in control of the cycle takes profits 2. Counter-trend positions are added by contrarian players 3. These are price points where limit orders are set by market-makers. You can find out more by reading the tutorial on The Magical 100% Fibonacci

