The S&P 500 has broken below its 2016-present trendline support, leaving some traders to wonder if the stock market will fall much more.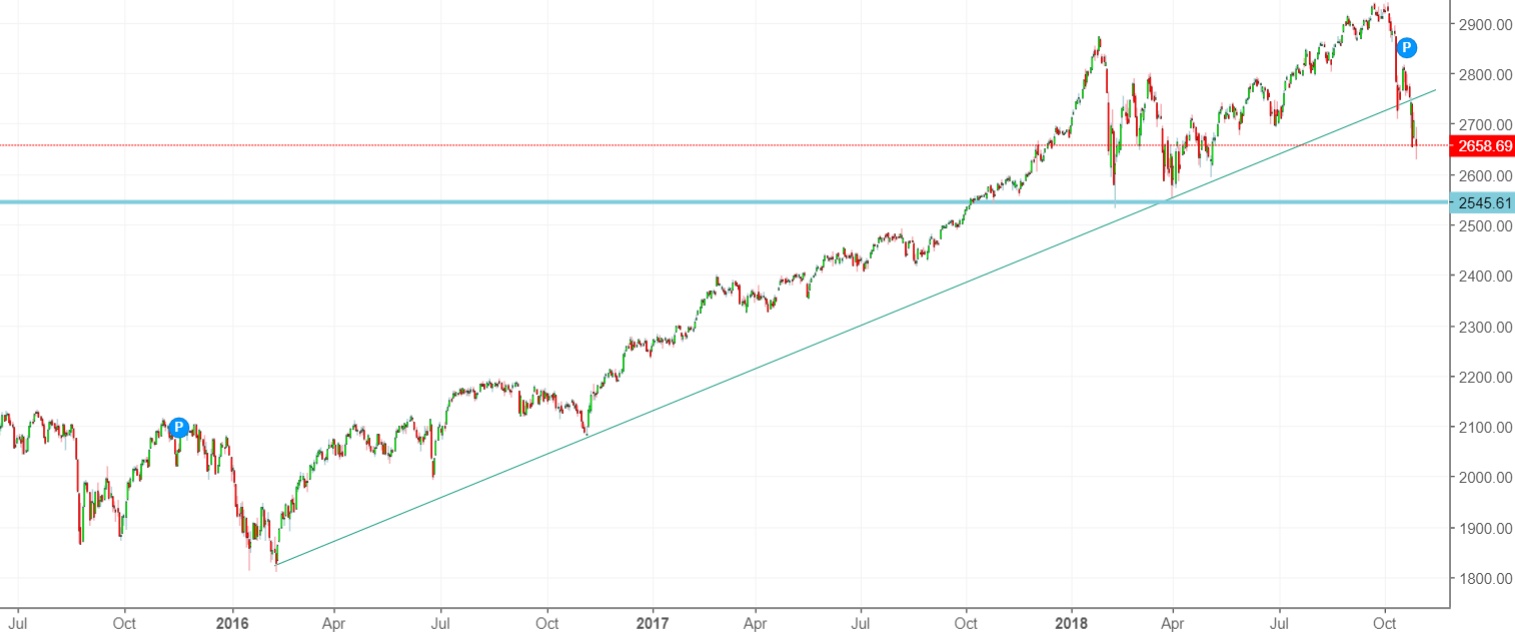
Here’s our long term, medium term, and short term outlook for the U.S. stock market. We focus on the long term and medium term. As U.S. stock market investors and traders, our job is to separate the signal from the noise.
As always, the economy’s fundamentals determine the stock market’s medium-long term outlook. Technicals determine the stock market’s short-medium term outlook. Here’s why:
- The stock market’s long term is bullish. The bull market will probably peak in mid-2019.
- The stock market’s medium term is bullish.
- The stock market’s short term is now a 50-50 bet (last week we said that the short term leaned bearish towards a retest or marginal new low).
Focus on the medium-long term. Let’s go from the long term, to the medium term, to the short term.
Long Term
Our long term outlook remains bullish. This bull market will probably last until mid-2019, after which a bear market will ensue.
The economy and the stock market move in the same direction in the long term. Hence, leading economic indicators are also long term leading stock market indicators.
Leading indicators are starting to show some signs of deterioration, but not enough for the bull market to peak (which means that September 2018 likely wasn’t the bull market’s top). The usual chain of events looks like this:
- Housing – the earliest leading indicators – starts to deteriorate. Meanwhile, the U.S. stock market is still in a bull market while the rest of the U.S. economy improves. The rally gets choppy, with volatile corrections along the way. We are here right now
- The labor market starts to deteriorate. Meanwhile, the U.S. stock market is still in a bull market. This hasn’t happened yet
- The labor market deteriorates some more, while other economic indicators start to deteriorate. The stock market tops, and the bull market is over.
Let’s look at the data.
Initial Claims and Continued Claims continue to trend downwards. In the past, these 2 data series trended upwards before bear markets and economic recessions began.
Corporate Profits continue to trend higher. In the past, this data trended lower for at least 2 quarters before bull markets topped.

Source: FRED
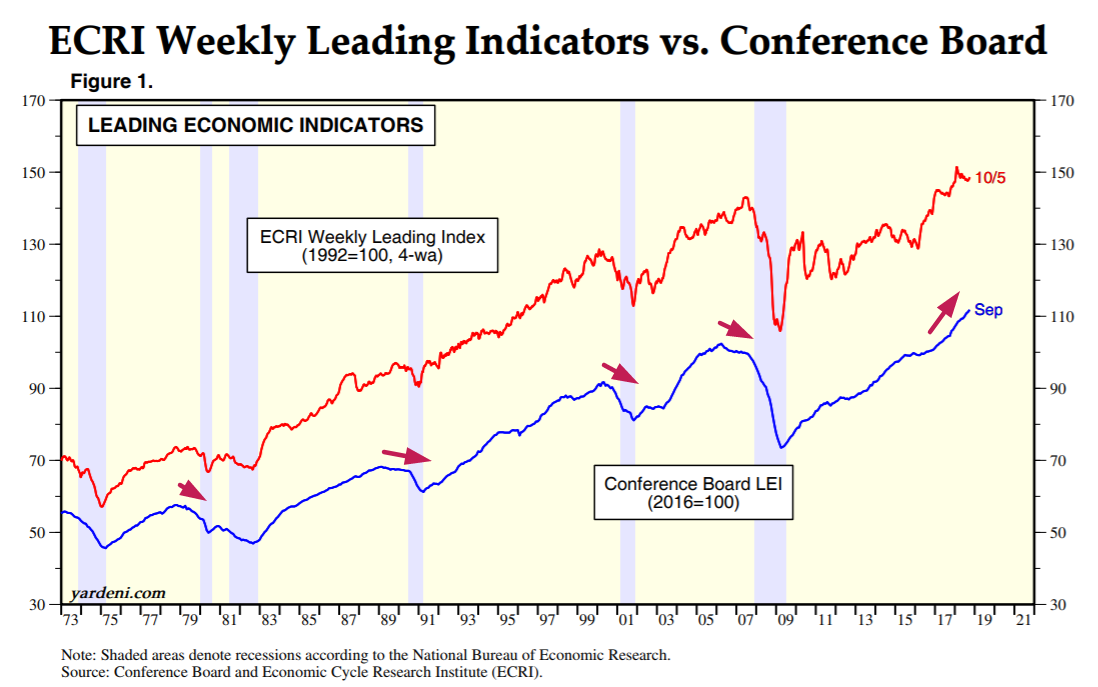
Meanwhile, the Conference Board’s Leading Economic Index continues to trend higher. In the past, this indicator trended downwards before bear markets and recessions began.
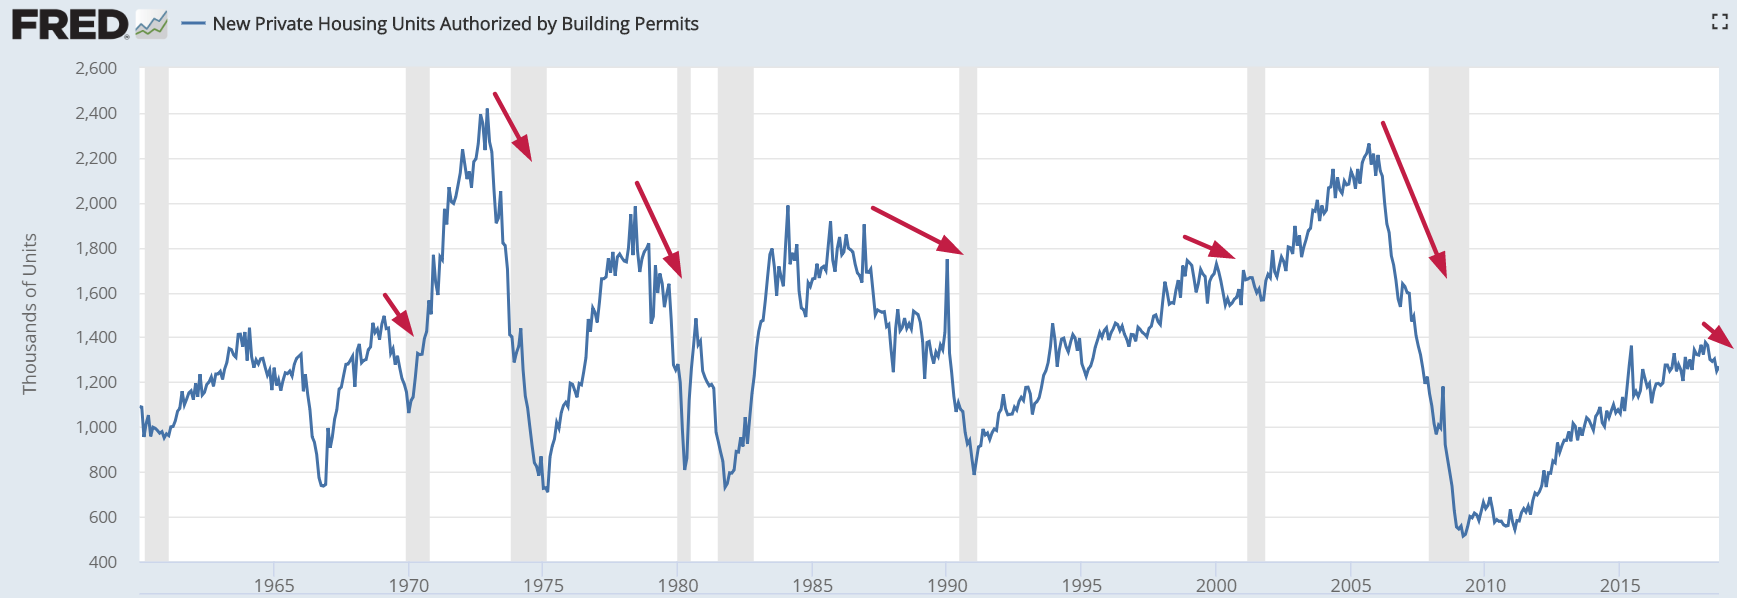
At the same time, there is some slight deterioration in the housing market. New Home Sales and Building Permits have trended downwards a little recently. This is not a major concern right now, but watch out if it continues to trend downwards for a few more months (i.e. into the start of 2019).
Medium Term
While the economic data suggests that September 2018 wasn’t the bull market’s top, let’s assume that we’re wrong. Let’s assume the worst case scenario, which is that September 2018 was the top.
Even if this is the start of a bear market, the stock market will probably soon make a medium term bounce. The big 40%+ bear markets (2007, 2000, 1973, 1969) don’t go down in a straight line. There are always big bounces along the way in the first 3-6 months of these bear markets as late buy-the-dip investors come in at what they deem to be “bargain prices”.
*For the sake of reference, here’s the random probability of the U.S. stock market going up on any given day, week, or month.
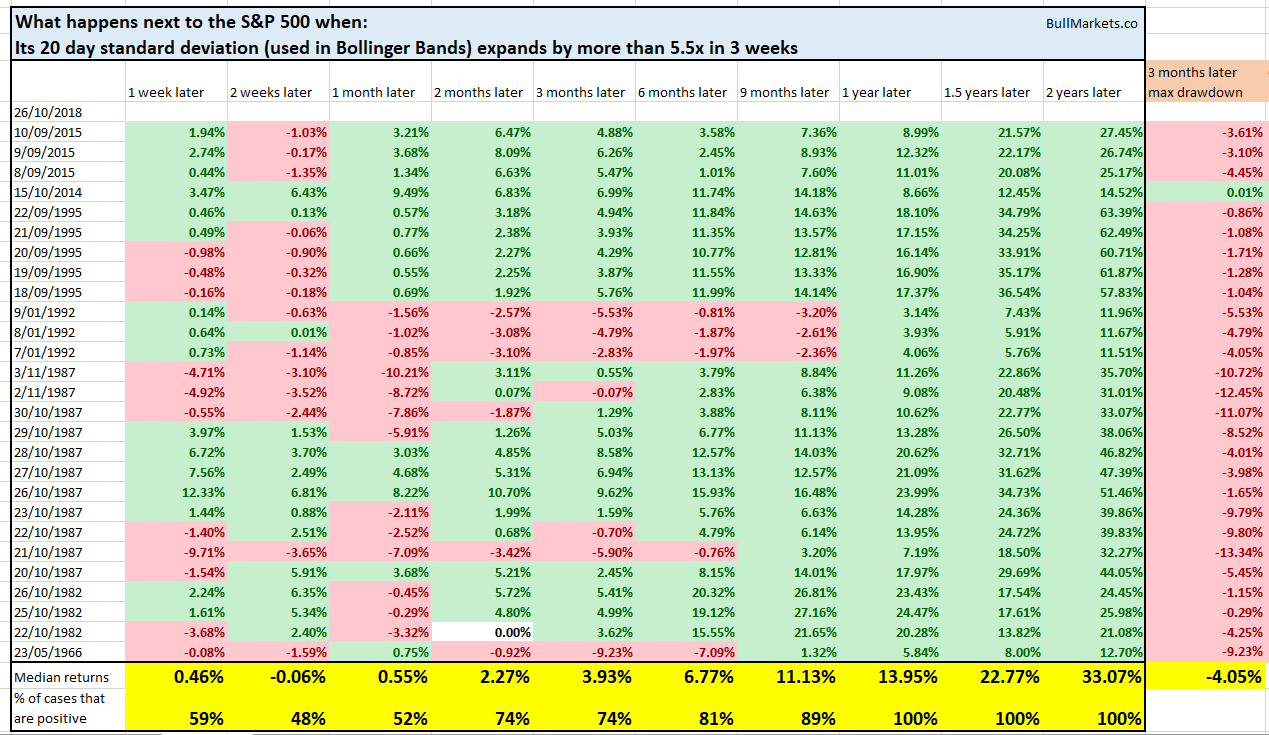
Volatility is extremely high right now. The S&P’s 20 day Bollinger Bands® have expanded by more than 5.5x in the past 3 weeks.
Here’s what happens next to the S&P 500 (historically) when its 20 day standard deviation (used in Bollinger Bands) expands by more than 5.5x in 3 weeks.
As you can see:
- The stock market can fall more in the short term, but…
- The next 6-12 months are bullish. Volatility is mean-reverting, and it moves in the opposite direction as the stock market.
As of Thursday, the Russell 2000 had fallen 26 out of the past 40 days. Even in the midst of 40%+ bear markets (e.g. 2001-2002 and 2008), this usually led to a medium term rally soon.
And as of Thursday, the NASDAQ’s breadth was extremely weak. Less than 32% of its stocks were above their 200 day moving average. When this happens, the stock market tends to fall more in the short term (which it did on Friday), but the next 6-12 months were bullish.
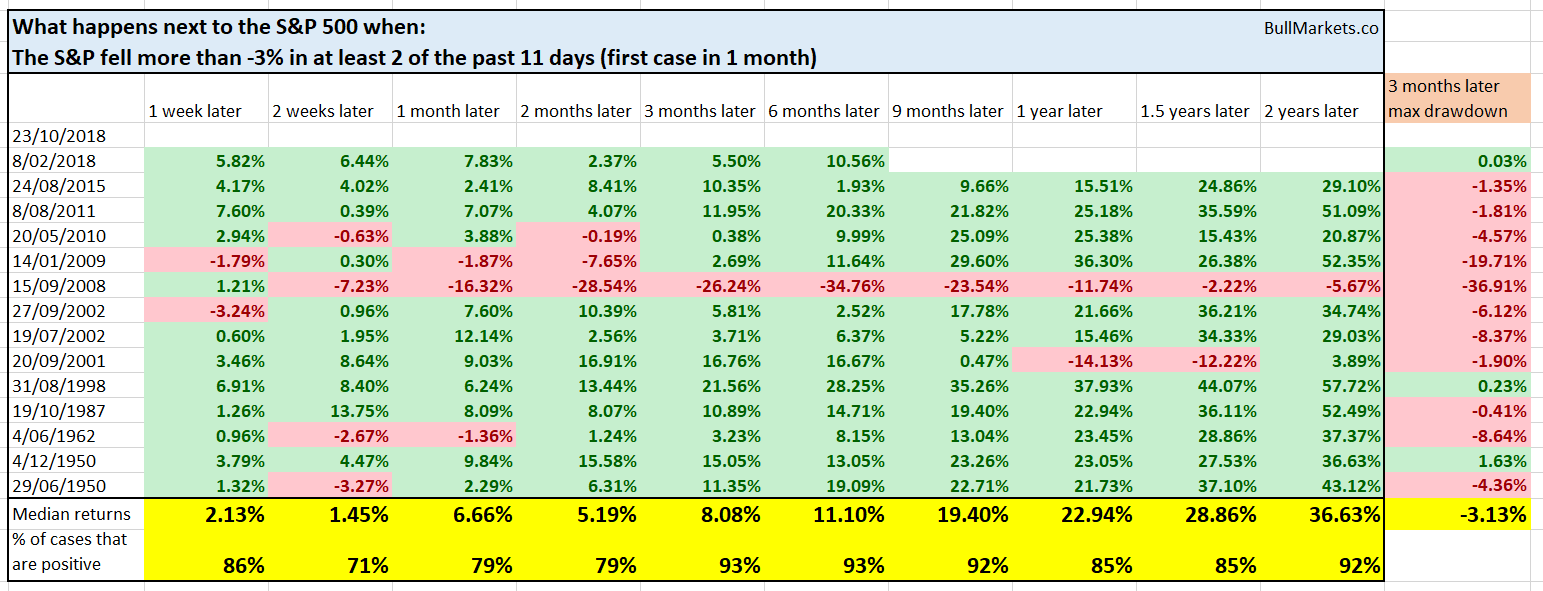
As of Wednesday, the S&P had crashed more than -3% in at least 2 of the past 11 days.
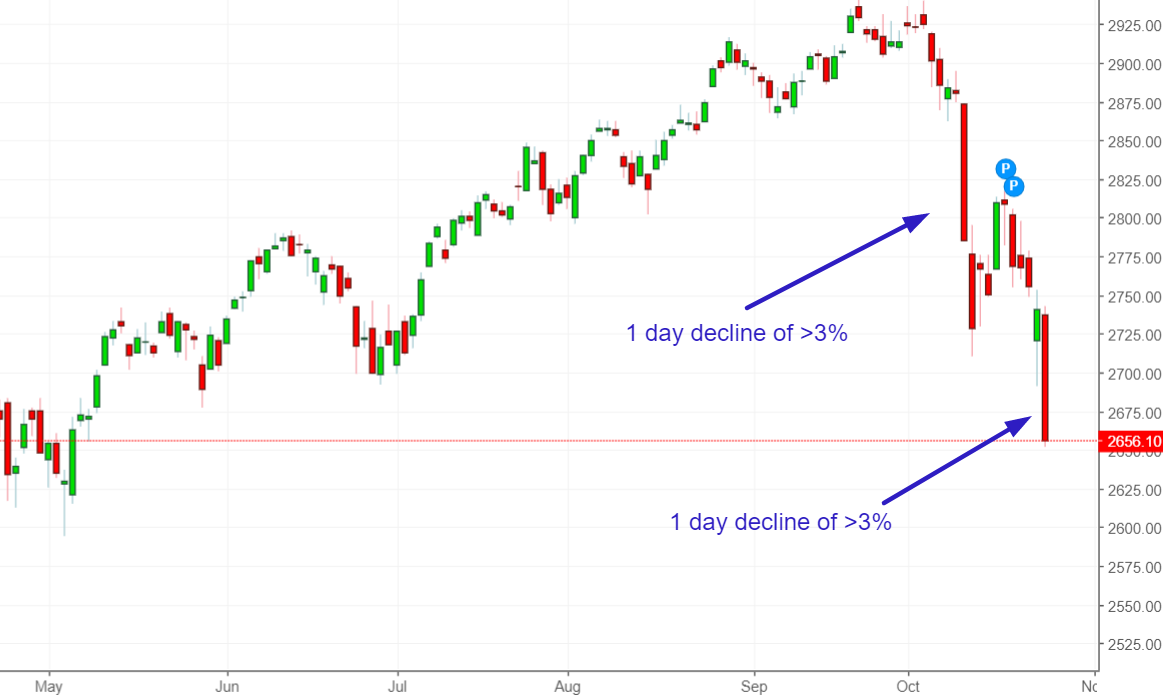
Source: Investing.com
Here’s what happens next to the S&P 500 (historically) when it falls more than -3% in at least 2 of the past 11 days.
Once again, the S&P tends to bounce 3-9 months later. The sole bearish case is September 2018, AFTER the S&P had already crashed 30%+. Clearly that’s a different context.
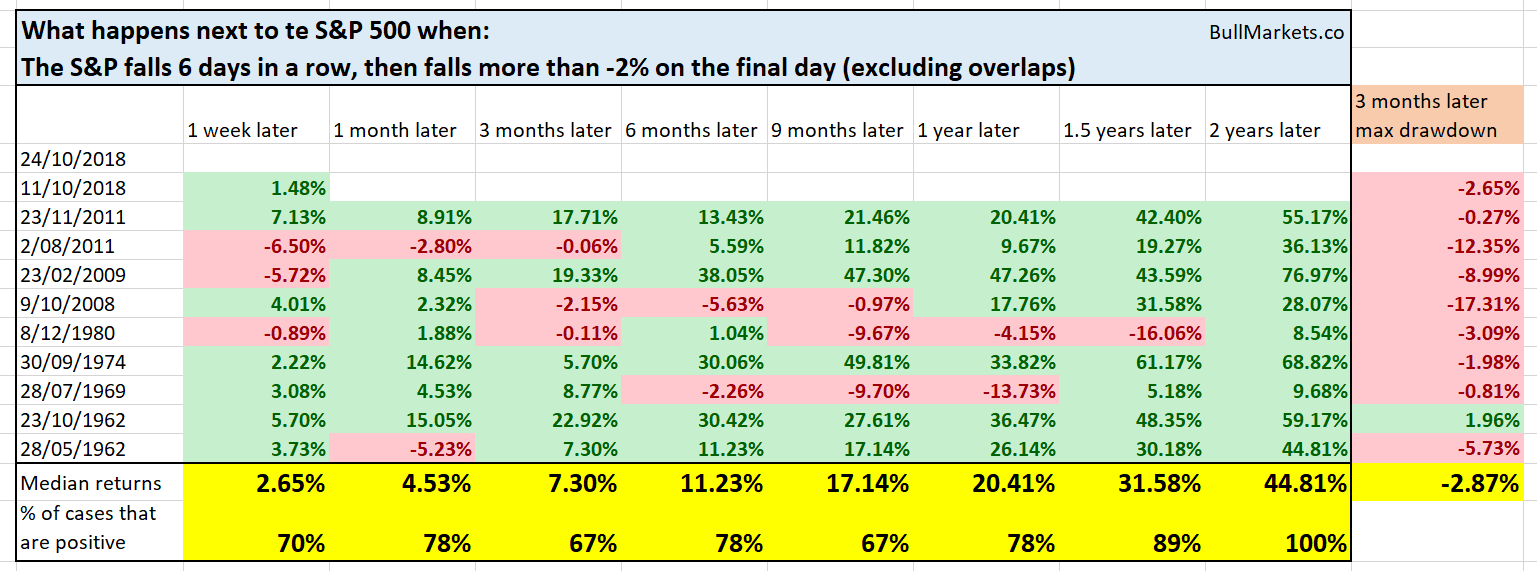
As of Wednesday, the S&P had fallen 6 days in a row with the final day (Wednesday) falling more than -2%. Did this ever mark the start of a bear market?
No. But this did come close to marking a lot of major medium term bottoms.
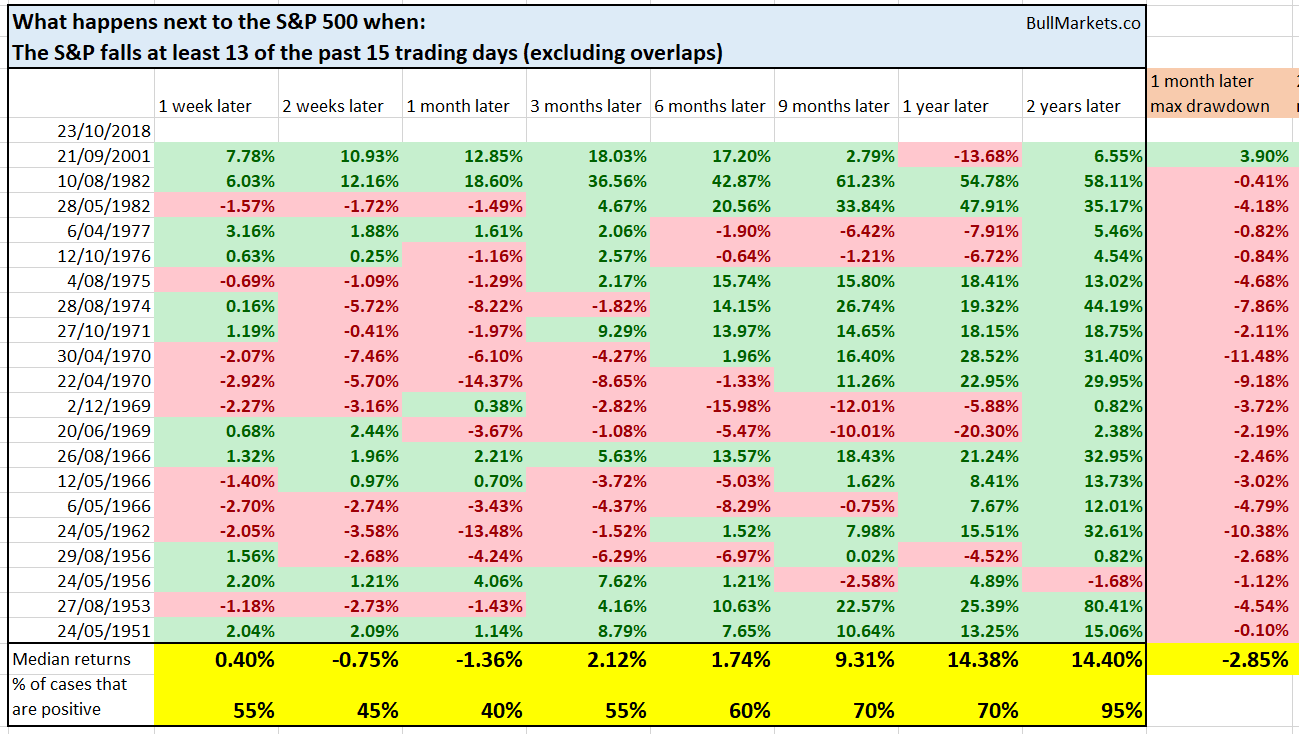
As of Wednesday, the S&P had fallen 13 of the past 15 days. Did any of these lead to a mega-bear market over the next 2 years? None except one case. And that case was a tiny loss (-1.6%). However, some short term weakness did ensue in the following 2-4 weeks.
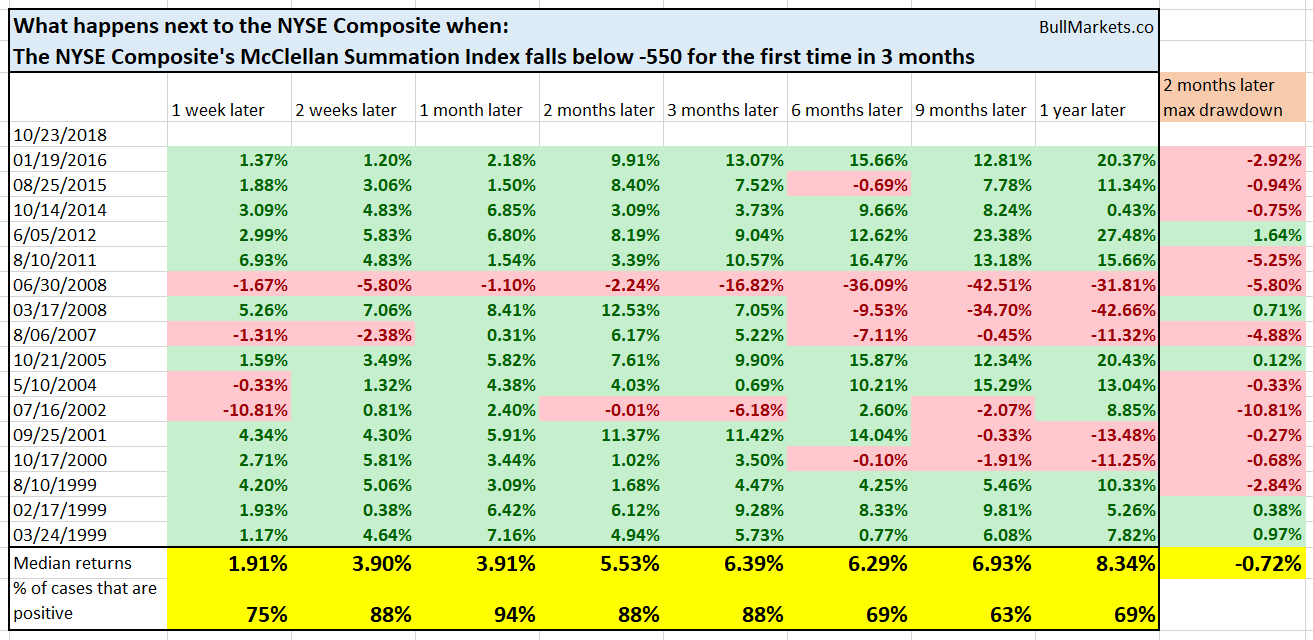
On Tuesday, the NYSE’s breadth was extremely low. Historically, this almost always led to a bounce 1 month later.
And on Tuesday, the S&P had closed below its 200 day moving average for 2 consecutive days. That was the first time in more than 2 years (since mid-2016).
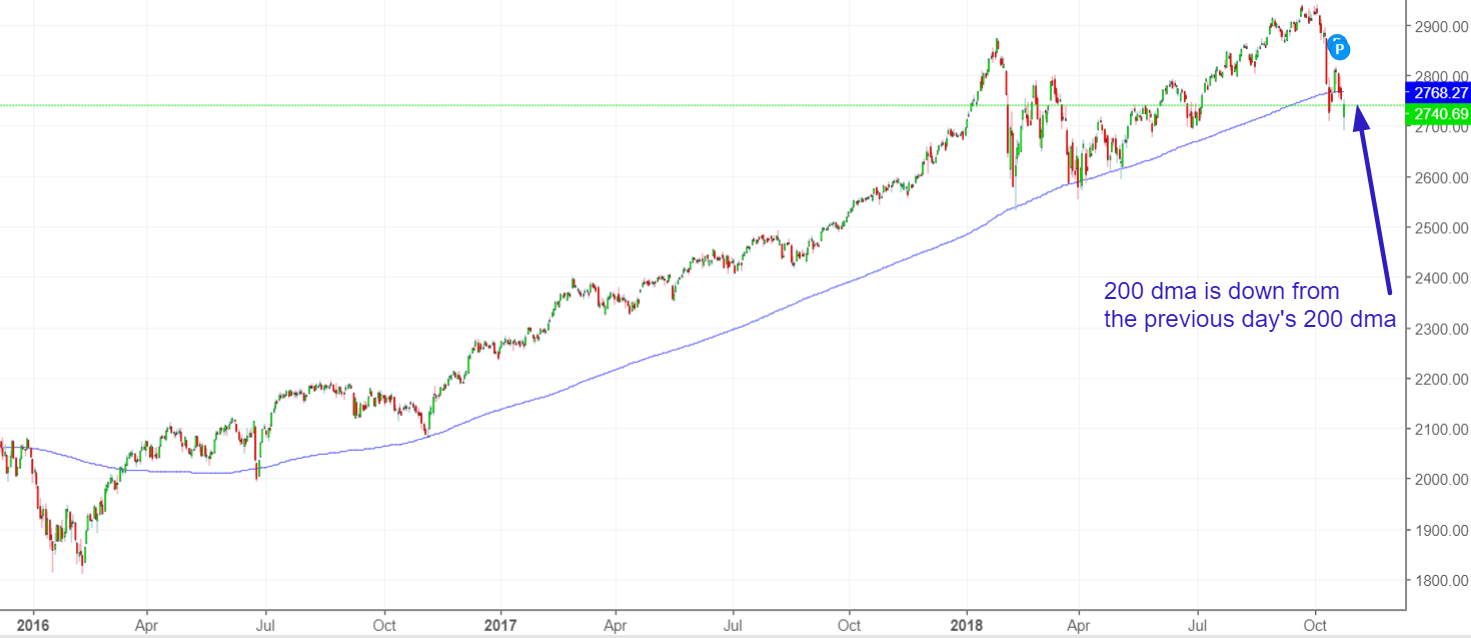
Source: Investing.com
Far from being a “breakdown in the trend”, the stock market was always higher 3 months later.
Short Term
The U.S. stock market’s short term outlook is mixed. Some studies are short term bearish, other studies are short term bullish. When this happens, the most likely result is that the stock market will swing sideways in a very volatile manner over the next few weeks.
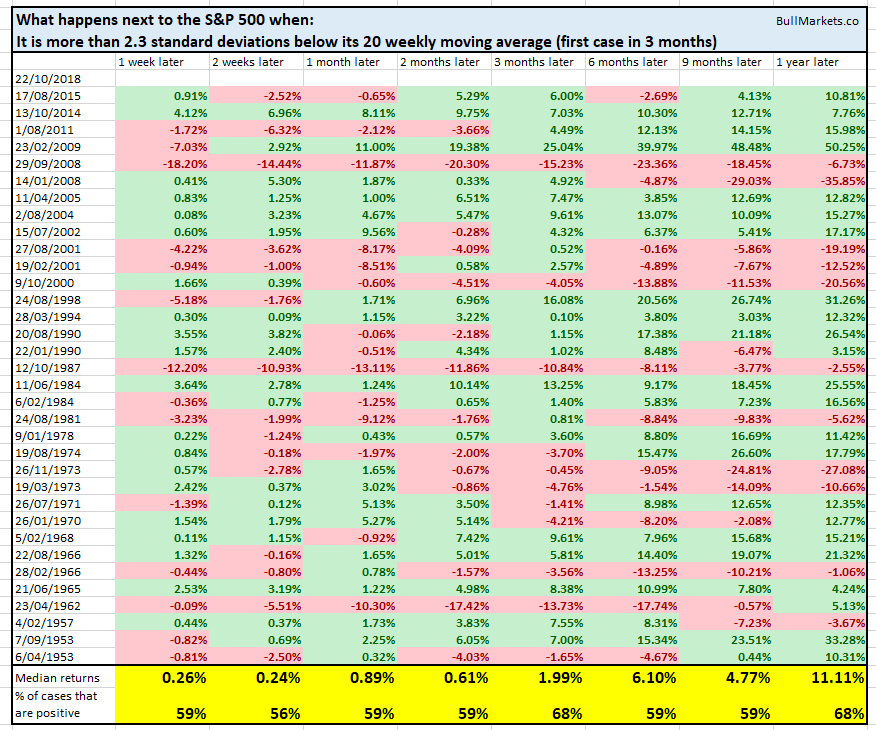
For example, the S&P is now more than -2.3 standard deviations below its 20 weekly moving average. When this happens, the stock market’s forward returns are volatile and mostly random.
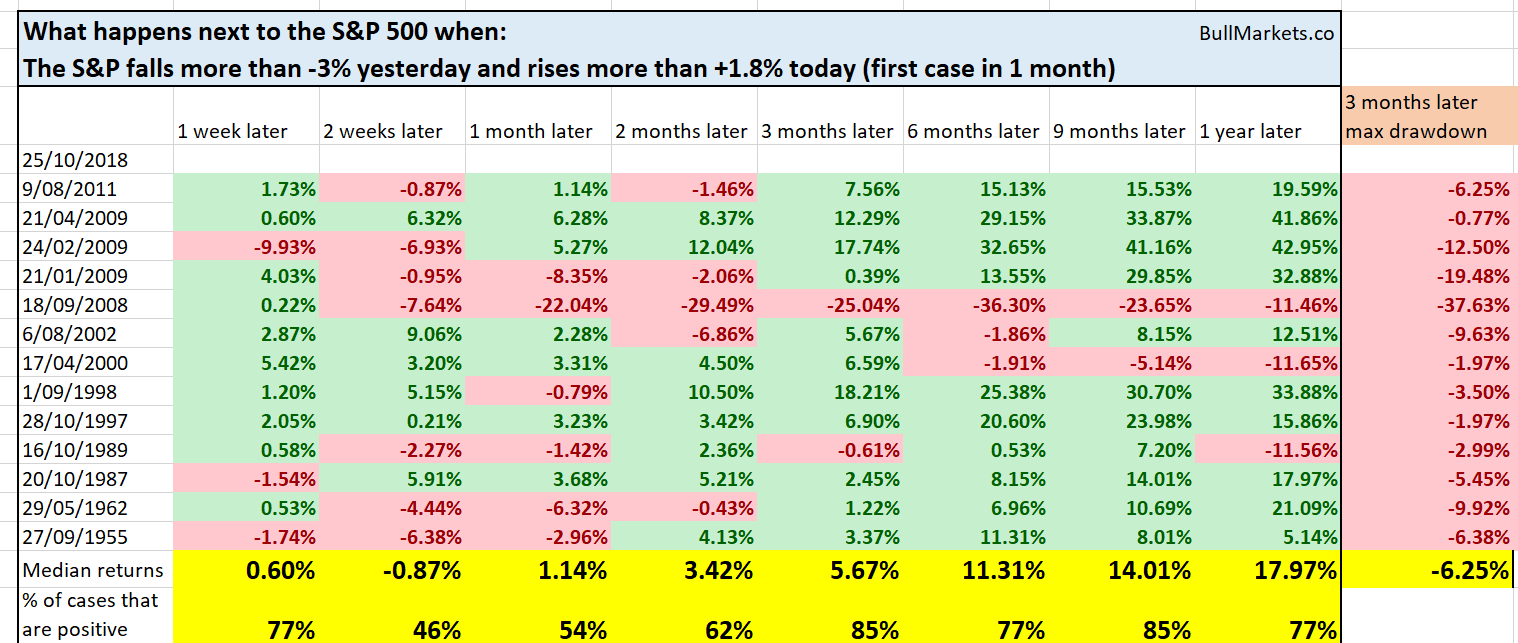
The S&P went up more than 1.8% on Thursday after falling more than -3% on Wednesday. When this happens, the stock market tends to be higher 1 week later.
And lastly, remember that the recent stock market correction has occurred with the absence of stock buybacks (due to earnings season). Once stock buybacks resume after earnings season (i.e. the “blackout period” is over)…
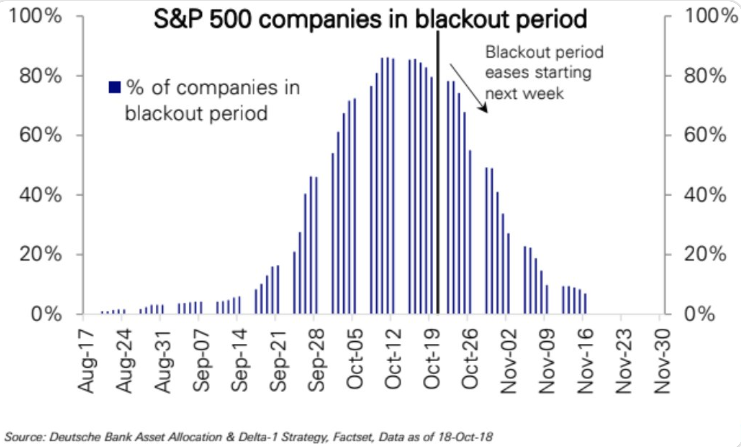 Source: Deutsche Bank (DE:DBKGn)
Conclusion
Here is our discretionary market outlook:
- The stock market’s long term is bullish. The bull market will probably peak in mid-2019.
- The stock market’s medium term is bullish. Even if this is the start of a bear market, there will probably be a medium term rally (couple of months).
- The stock market’s short term is a 50-50 bet (last week we said that the short term leaned bearish towards a retest or marginal new low).
So if you’re long right now and afraid that “the world is ending, a bear market is here”, what should you do?
If you sell now, you will probably end up selling near the bottom of the crash. Wait for the bounce.
Here is the 2007 bull market top. After falling 10% (which is how much the S&P has fallen right now), it still bounced and made a 61.8% retracement.
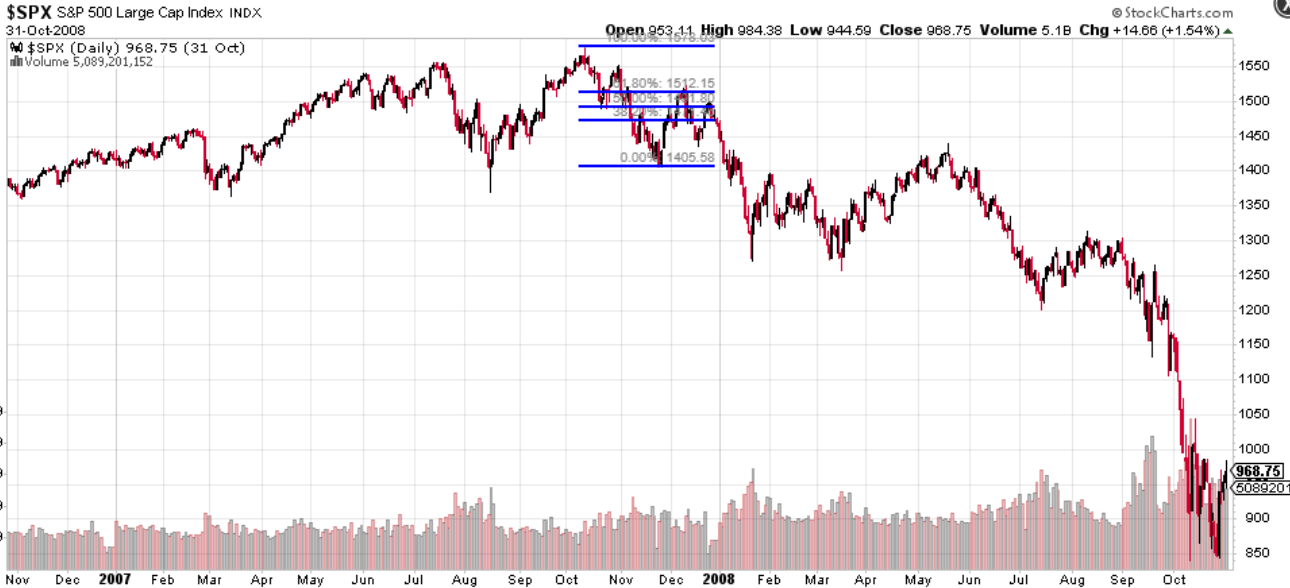
Source: StockCharts
Even after that initial bounce in late-2007, the S&P made another >50% retracement from March – May 2008.
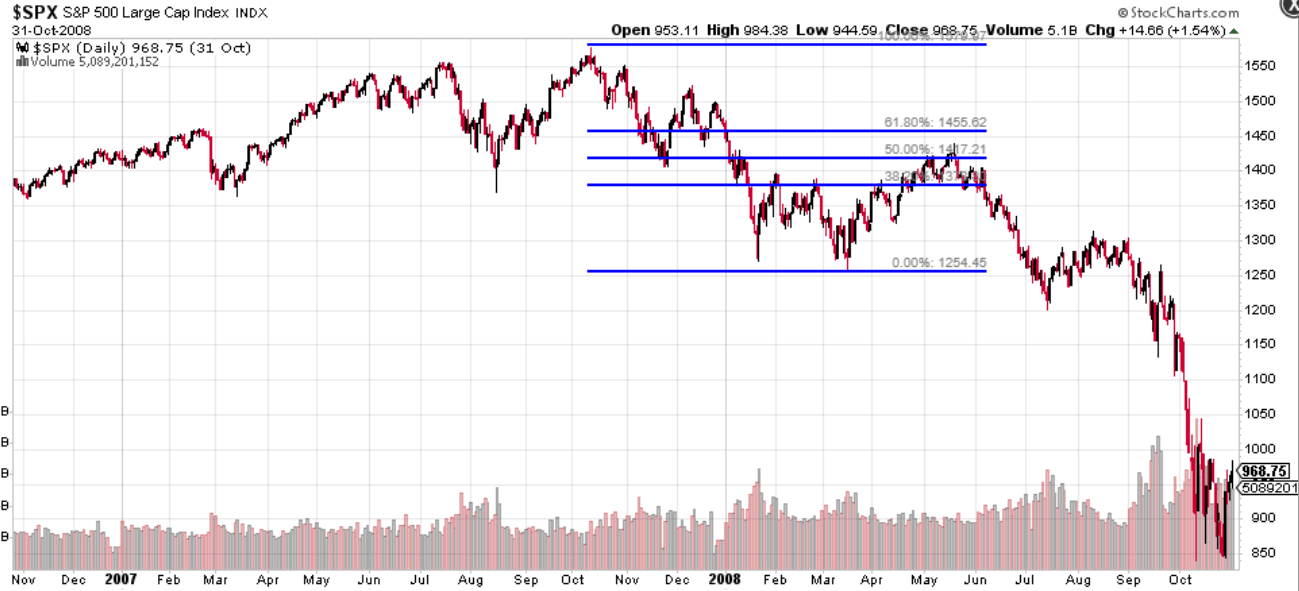
Source: StockCharts
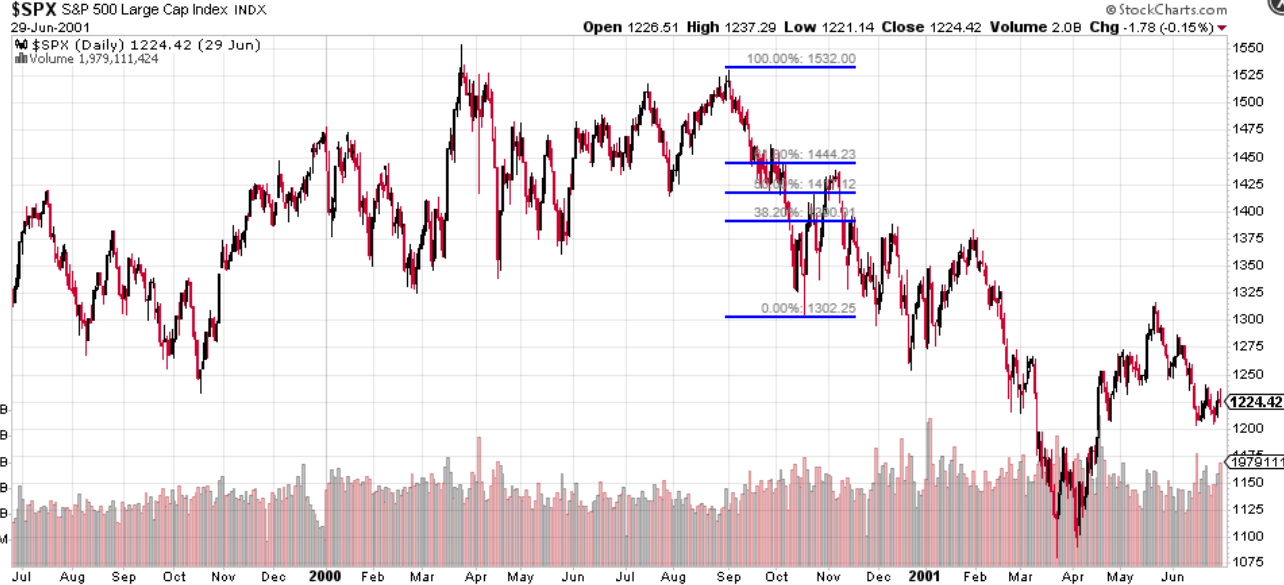
Here is the 2007 top. Notice how after topping in March 2000, the S&P swung sideways in a massive range for 5 months. Selling at the top of the range (i.e. after a bounce) is much better than selling at the bottom of the range.
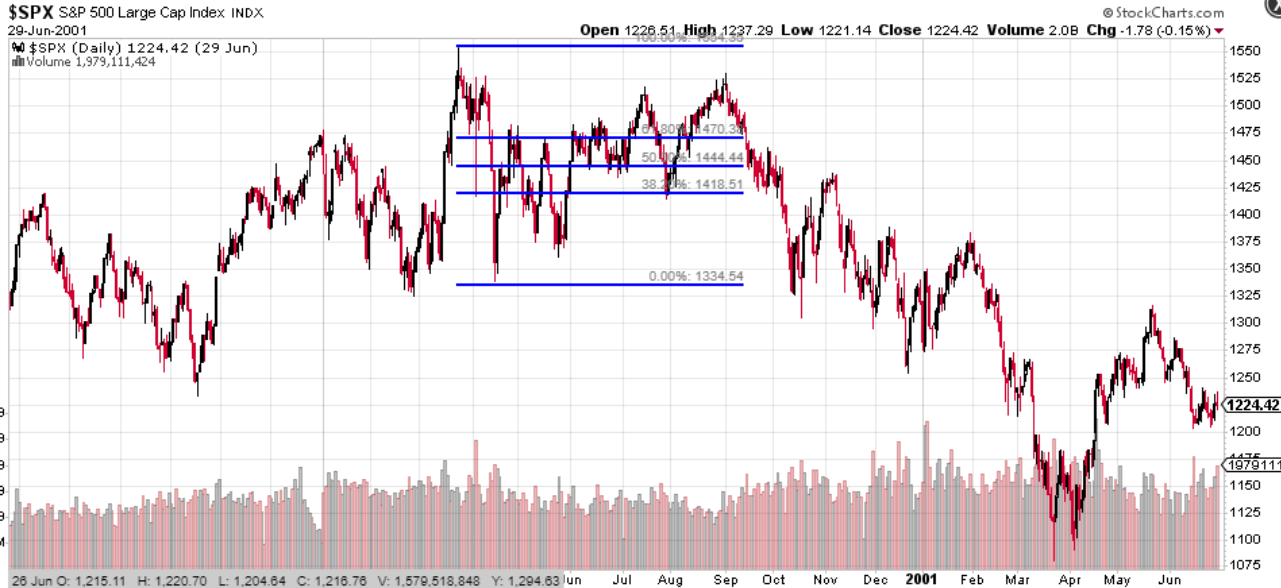
Source: StockCharts
Even after the stock market really started to go down in September 2000, it still made a >50% retracement bounce along the way. Bear markets don’t go down in a straight line.
Source: StockCharts
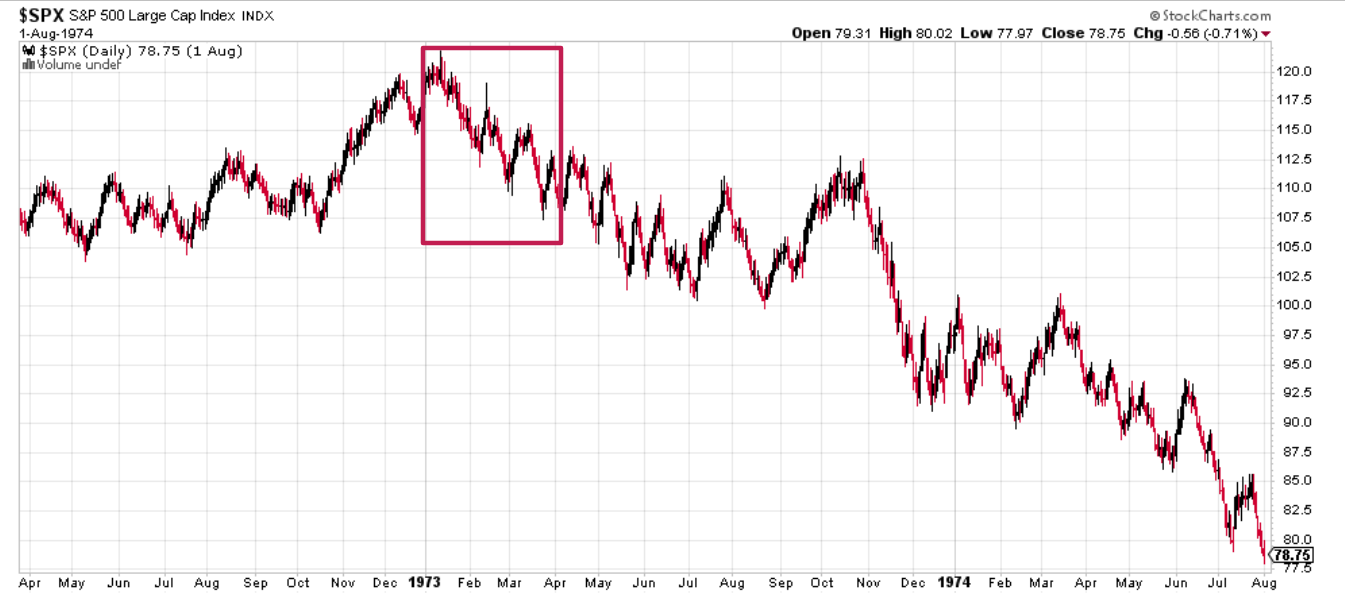
Here’s the 1973 bull market top. Notice how the first leg of the bear market had A LOT of big bounces along the way.
Source: StockCharts
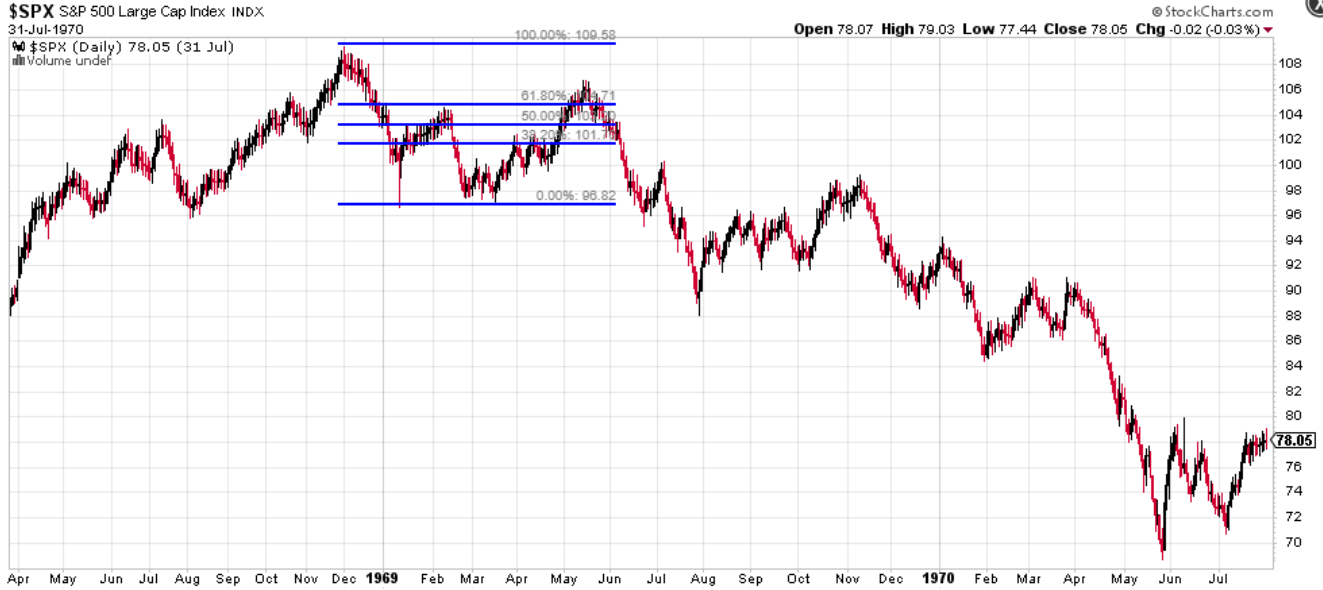
Here’s the 1968 bull market top. Even after the bull market topped and the stock market tanked, it still made a big bounce. Cut your longs on the big bounce, don’t sell into the crash.
Source: StockCharts
Our discretionary outlook is usually, but not always, a reflection of how we’re trading the markets right now. We trade based on our clear, quantitative trading models, such as the Medium-Long Term Model.


