Here are some interesting charts in no particular order. Over recent months, market conditions remain quite interesting for both traders and investors. We have been discussing and trading US dollar strength, euro weakness, Treasury yield curve flattening, Grains in a crash mode, a reversal in Oil prices, the euphoric rise of the US tech sector, Gold and Silver potentially breaking down lower and lack of bears in the stock market as almost no one wants to fight central banks.
Chart 1: Dollar Trade Weighted Index approaching 52 week new highs
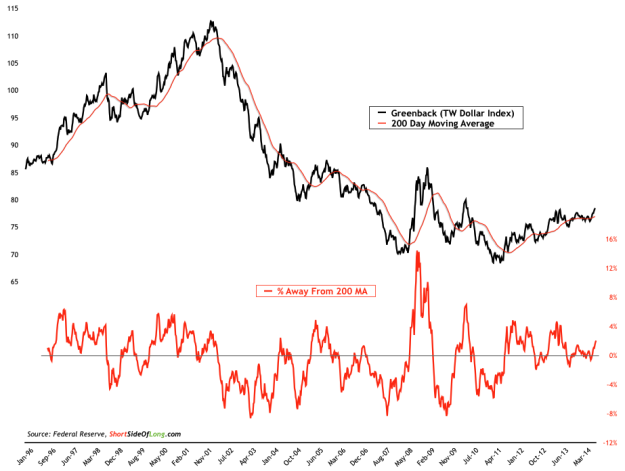
Chart 2: Treasury 5-Year yield is approaching a breakout on the upside
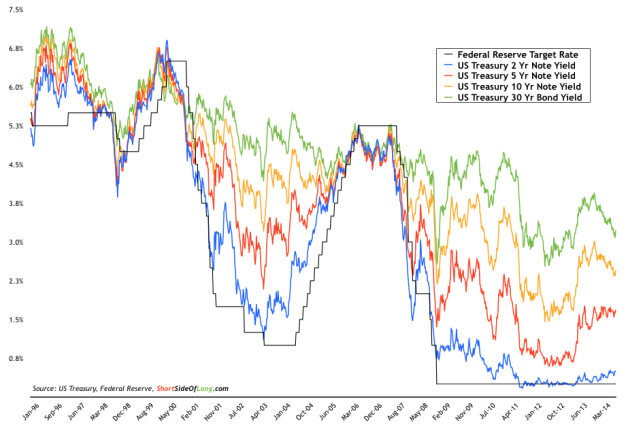
Chart 3: Corn prices are going through the biggest bear market since ’96
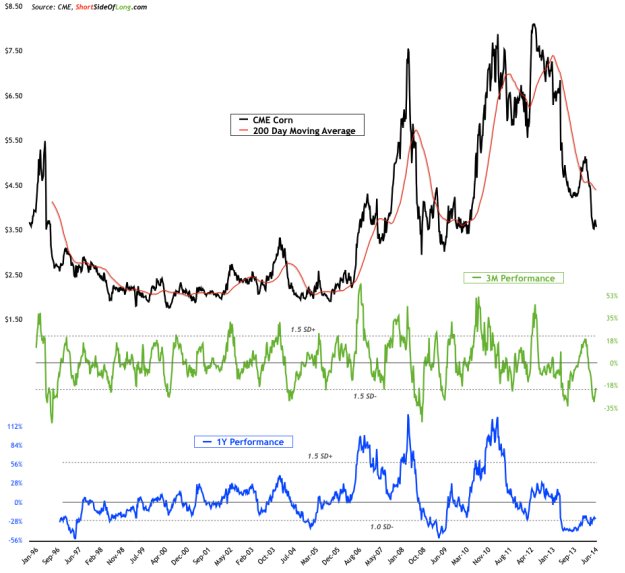
Chart 4: After a failed breakout Brent Crude Oil has started its correction
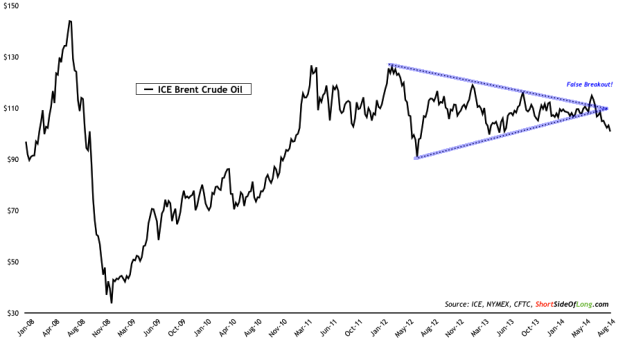
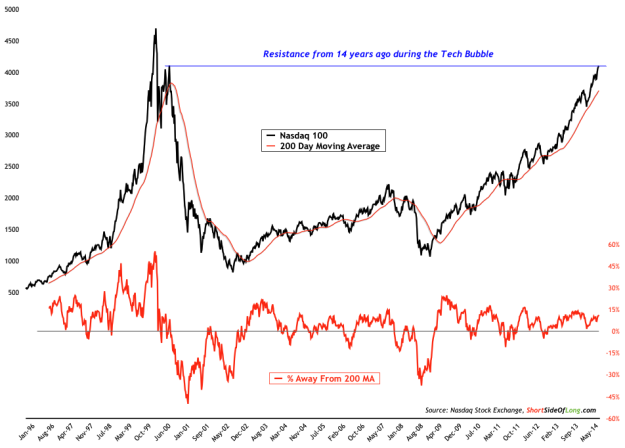
Chart 5: NASDAQ 100 at 14 year resistance from the Tech bubble days
Chart 6: Gold price consolidation might be ending with a breakdown…
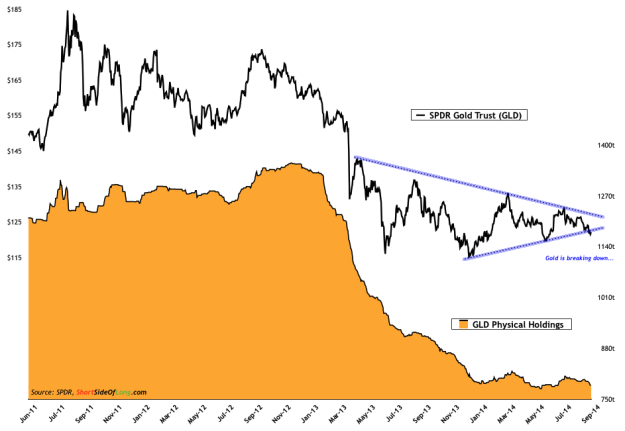
Chart 7: Silver is trading in a narrow range for more then a year now
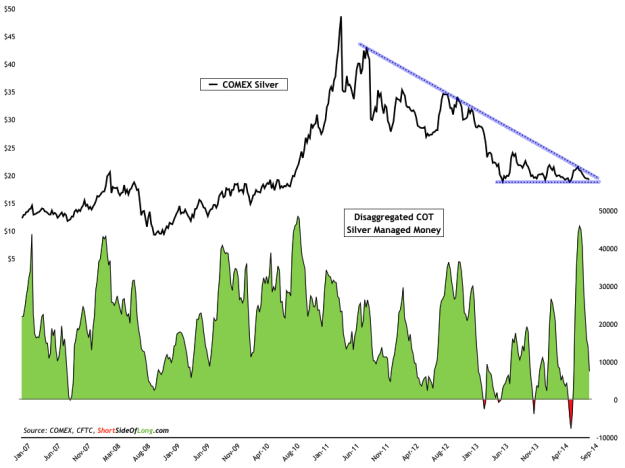
Chart 8: Bearish S&P 500 capitulation as hardly any one fights the central banks
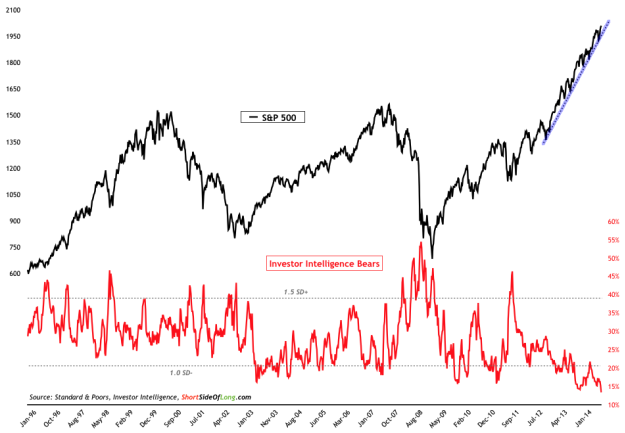
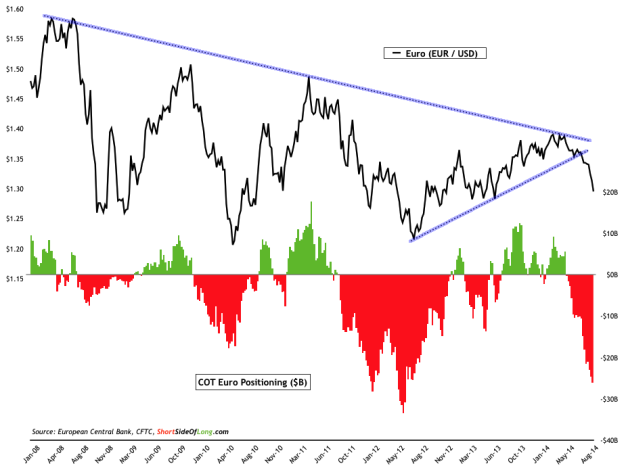
Chart 9: ECB starts its money printing program as euro collapses lower
Which stock should you buy in your very next trade?
AI computing powers are changing the stock market. Investing.com's ProPicks AI includes 6 winning stock portfolios chosen by our advanced AI. In 2024 alone, ProPicks AI identified 2 stocks that surged over 150%, 4 additional stocks that leaped over 30%, and 3 more that climbed over 25%. Which stock will be the next to soar?
Unlock ProPicks AI
