Just last week, we discussed the risk of the market not paying attention to the virus. To wit:
“With the market now trading 12% above its 200-dma, and well into 3-standard deviations of the mean, a correction is coming.’ But the belief is currently ‘more stimulus’ will offset the ‘virus.’
This is probably a wrong guess.
Extensions to this degree rarely last long without a correction. Maintain exposures, but tighten up stop-losses.”
Unfortunately, it escalated more rapidly than even we anticipated.
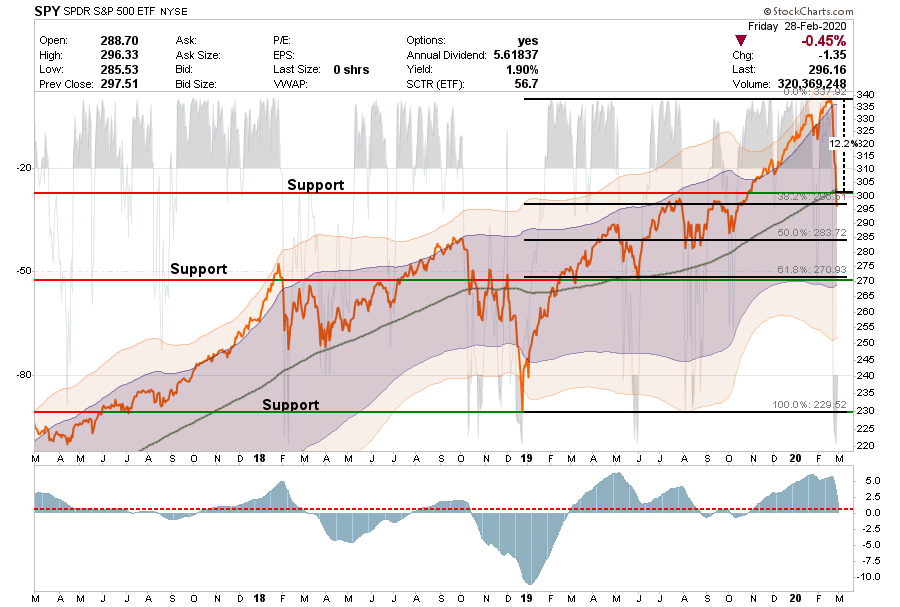
“It only took the S&P 500 six days to fall from an all-time high into correction levels, marking the broad index’s fastest drop of that magnitude outside of a one-day crash. Friday’s losses built on this week’s massive losses. The Dow and S&P 500 have fallen 14% and 13%, respectively, week to date. The two indexes were on pace for their biggest one-week loss since the 2008 financial crisis. The Nasdaq has lost 12.3% this week.” – CNBC
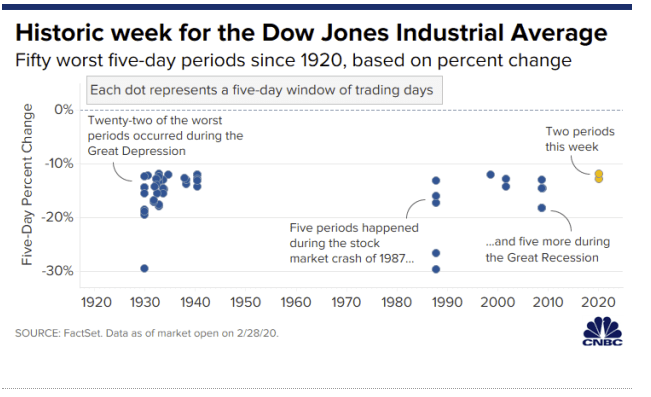
If that headline doesn’t startle you, you are also probably lacking a pulse.
However, it was two Monday’s ago, CNBC was cheering the market’s record highs and dismissing the impact of the virus as “it was just people getting sick in China.” We disagreed, which is why over the last several weeks, we have been detailing our warnings.
- Market Vaccine For Virus Is More Fed’s “NotQE”
The correction this past week has been in the making for a while. It is why we have discussed carrying extra cash, adjusting our bond positioning, and rebalancing portfolio risks weekly for the past couple of months. Just as a reminder, this is what we wrote last week:
While those actions did not entirely shield our portfolios for such a steep and swift correction, it did limit the damage to a great degree.
This now gives us an opportunity to use the correction as an opportunity to “buy assets” which are now oversold and have a much improved “risk vs reward” profile.
This is the advantage of “risk management” versus a “buy and hold” strategy. You can’t “buy cheap” if you don’t have any cash to “buy” with.
I want to use the rest the article this week to quickly review the market after the brutal selloff this past week. Here are the questions we want to answer:
- Is the correction over?
- Is this a buying opportunity?
- Has the decade long bull market ended?
Let’s review some charts, and I will answer these questions at the end.
Daily
On a daily basis, the market is back to a level of oversold (top panel) rarely seen from a historical perspective. Furthermore, the rapid decline this week took the markets 5-standard deviations below the 50-dma.
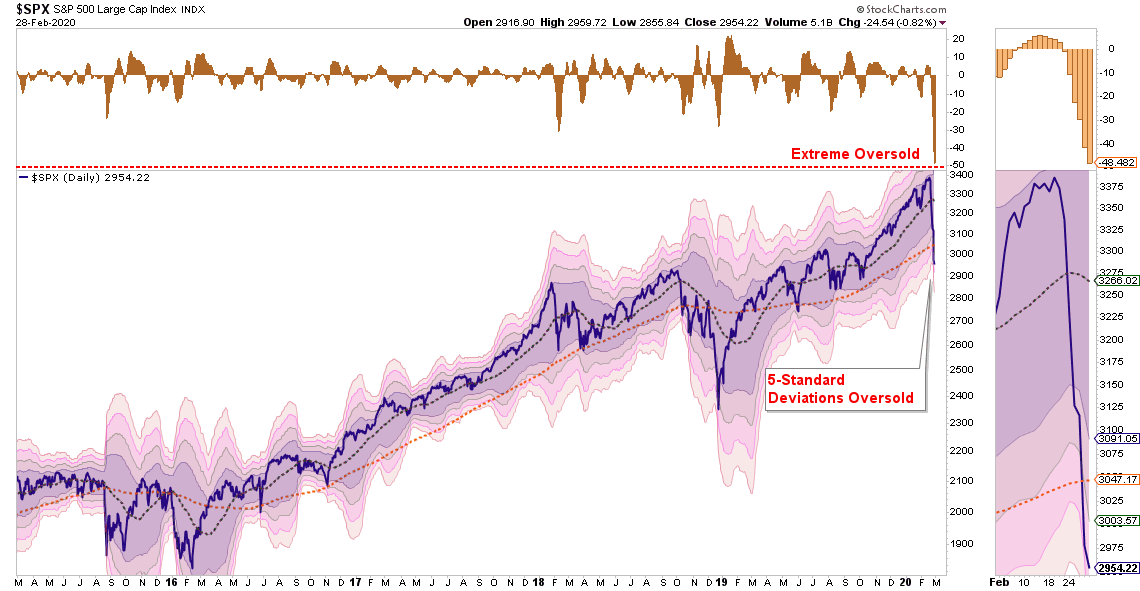
To put this into some perspective, prices tend to exist within a 2-standard deviation range above and below the 50-dma. The top or bottom of that range constitutes 95.45% of ALL POSSIBLE price movements within a given period.
A 5-standard deviation event equates to 99.9999% of all potential price movement in a given direction.
This is the equivalent of taking a rubber band and stretching it to its absolute maximum.
Importantly, like a rubber band, this suggests the market “snap back” could be fairly substantial, and should be used to reduce equity risk, raise cash, and add hedges.
If we rework the analysis a bit, we can see in both the top and bottom panels the more extreme oversold condition. Assuming a short-term bottom was put in on Friday, a reflexive “counter-trend” rally will likely see the markets retrace back 38.2% to 50% of the previous decline.
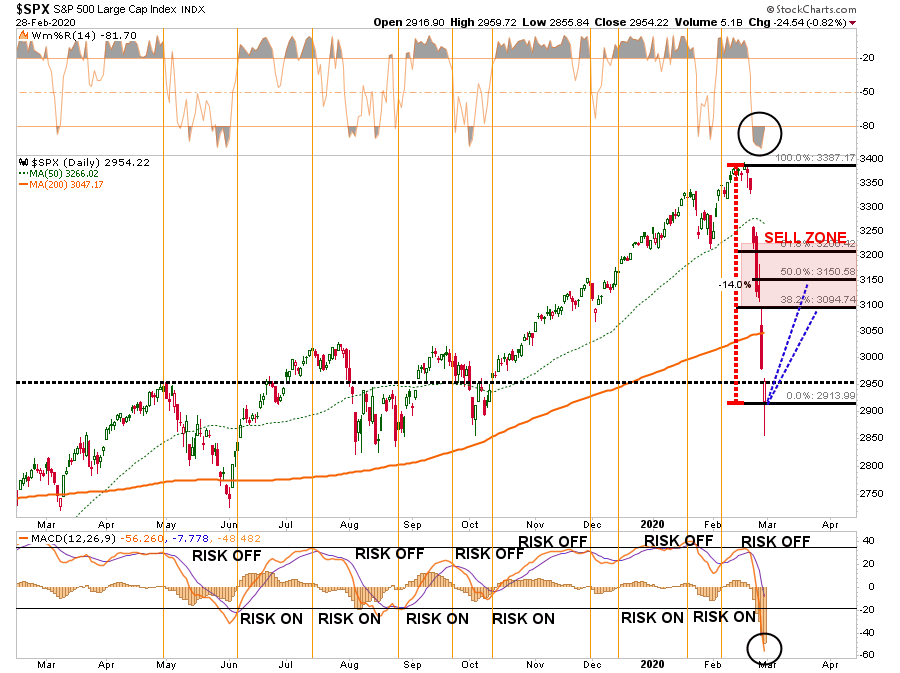
Given the beating that many investors took over the past week, it is highly likely any short-term rallies will be met with more selling as investors try and “get out” of the market.
Weekly
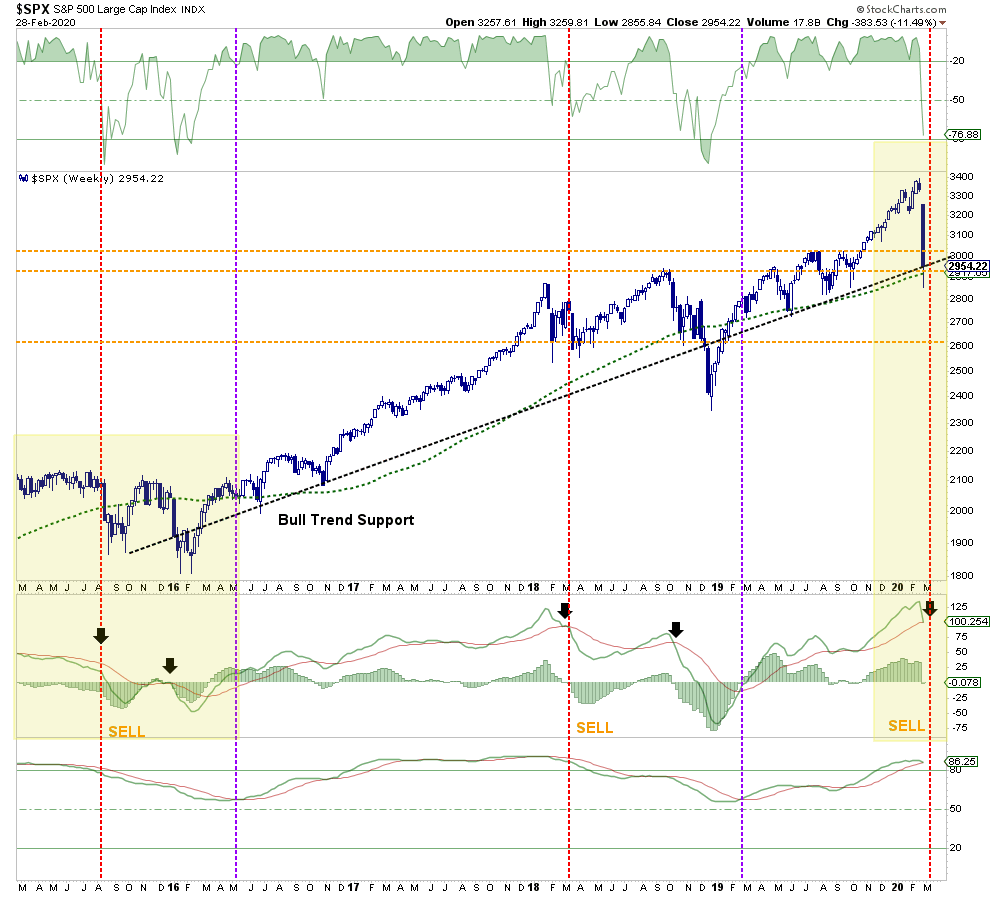
On a weekly basis, the rising “bull trend support” from the 2016 lows is clear. That trend also coincides with our longer-term moving average which drives our allocation models.
Importantly, the market decline this past week DID NOT violate that trend currently, which suggests maintaining our allocation to equity risk in portfolios currently. However, the two longer-term sell signals, bottom panels, are close to registering a “risk reduction” change to our portfolios. (This will reduce our model from 100% to 75%)
With the market currently very oversold, individuals are quick to assume this is 2018 all over again. However, the technical backdrop from where the signals are being triggered is more akin to 2015-2016 (yellow highlights). Such suggests that a rally will likely give way to another decline before the final bottom is in place.
Monthly
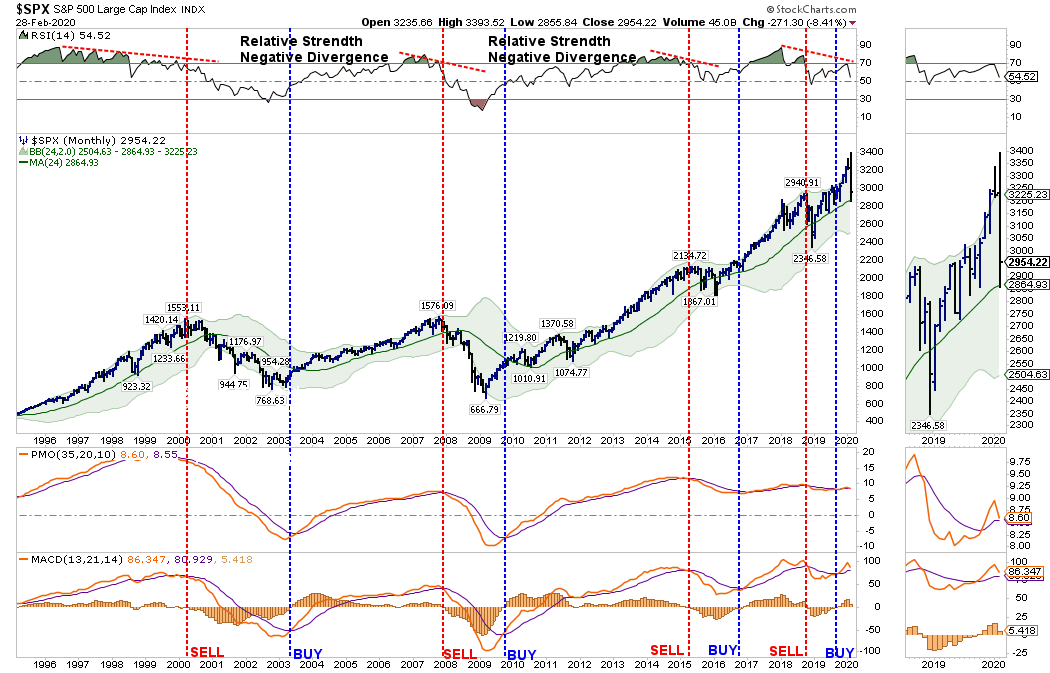
This chart has ONE purpose, to tell us when a “bear market” has officially started.
On a monthly basis, the bulls remain in control. The decline in the market this past week wiped out all the “Fed Repo” gains from last October.
However, there are some VERY important points of concern that we will likely see play out over the rest of 2020.
The most important WARNING is the negative divergence in relative strength (top panel). This negative divergence was seen at every important market correction event over the last 25-years.
As we have noted previously:
“The market had triggered a ‘buy’ signal in October of last year as the Fed ‘repo’ operations went into overdrive. These monthly signals are ‘important,’ but it won’t take a tremendous decline to reverse those signals.
It’s okay to remain optimistic short-term, just don’t be complacent.”
As shown in the bottom two panels, both of the monthly “buy” signals are very close to reversing. It will take a breakout to “all-time highs” at this point to keep those signals from triggering. This lends support to our thesis of how the rest of 2020 will play out.
Let’s Answer Those Important Questions
Is the correction over?
Given the extreme 5-standard deviation below the 50-dma, combined with the massive short-term oversold condition discussed above, it is very likely we have seen the bulk of the correction on a short-term basis.
This is NOT an absolute statement, promise, or guarantee. It is the best guess. If there is a major outbreak of the virus in the U.S., or the Fed fails to act, or a myriad of other factors, another wave of selling could easily be sparked.
Is this a buying opportunity?
For longer-term investors, people close to, or in, retirement, or for individuals who don’t pay close attention to the markets or their investments, this is NOT a buying opportunity.
While we have, and will, likely add some “trading rentals” to our portfolio for a reflexive bounce, they will be sold appropriately, risk reduced, and hedges added accordingly.
Let me be clear.
There is currently EVERY indication given the speed and magnitude of the decline, that any short-term reflexive bounce will likely fail. Such a failure will lead to a retest of the recent lows, or worse, the beginning of a bear market brought on by a recession.
Please read that last sentence again.
Has the decade long bull market ended?
As noted in the last chart above, the bull market that began in 2009 has NOT ended as of yet. This keeps our portfolios primarily long-biased at the current time.
With that said, our primary concern is that the impact on the global supply chain in China, South Korea, and Japan will have much more severe economic impacts than currently anticipated which will likely push the U.S. economy towards a recession later this year. (This is something the collapsing yield curve is already suggesting.)
Importantly, the global supply chain is an exogenous risk that monetary interventions can NOT alleviate. (Supplying liquidity to financial markets does not fix plants being closed, people slowing consumption, transportation being halted, etc.)
As noted in the monthly chart above, it is entirely possible that by mid-summer we could well be dealing with a recessionary economic environment, slower earnings growth, and rising unemployment. Such will cause markets to reprice current valuations leading to the onset of a bear market.
The purpose of the analysis above is to provide you with the information to make educated guesses about the “probabilities” versus the “possibilities” of what could occur in the markets over the months ahead.
It is absolutely “possible” the markets could find a reason to rally back to all-time highs and continue the bullish trend. (For us, such would be the easiest and best outcome.)
However, the analysis currently suggests the risks currently outweigh potential reward and a deeper correction is the most “probable” at this juncture.
Don’t take that statement lightly.
I am suggesting reducing risk opportunistically, and being pragmatic about your portfolio, and your money.
Here are our rules that we will be following on the next rally.
- Move slowly. There is no rush in making dramatic changes. Doing anything in a moment of “panic” tends to be the wrong thing.
- If you are over-weight equities, DO NOT try and fully adjust your portfolio to your target allocation in one move. Again, after big declines, individuals feel like they “must” do something. Think logically above where you want to be and use the rally to adjust to that level.
- Begin by selling laggards and losers. These positions were dragging on performance as the market rose and they led on the way down.
- Add to sectors, or positions, that are performing with, or outperforming the broader market if you need risk exposure.
- Move “stop-loss” levels up to recent lows for each position. Managing a portfolio without “stop-loss” levels is like driving with your eyes closed.
- Be prepared to sell into the rally and reduce overall portfolio risk. There are a lot of positions you are going to sell at a loss simply because you overpaid for them to begin with. Selling at a loss DOES NOT make you a loser. It just means you made a mistake. Sell it, and move on with managing your portfolio. Not every trade will always be a winner. But keeping a loser will make you a loser of both capital and opportunity.
- If none of this makes any sense to you – please consider hiring someone to manage your portfolio for you. It will be worth the additional expense over the long term.
While we remain optimistic about the markets currently, we are also taking precautionary steps of tightening up stops, adding non-correlated assets, raising some cash, and looking to hedge risk opportunistically on any rally.
Everyone approaches money management differently. This is just our approach to the process of controlling risk.
We hope you find something useful in it.
