T2108 Status: 66.0%
VIX Status: 12.1
General (Short-term) Trading Call: Aggressive bears hold onto shorts but be ready to stop out. Trend followers get ready to re-enter. See below for more, especially on individual stocks
Active T2108 periods: Day #238 over 20%, Day #90 over 40%, Day #17 over 60% (overperiod), Day #5 under 70% (underperiod)
Commentary
The Federal Reserve rolls out another pronouncement on monetary policy today, June 18th, so I cannot over-speculate on the market’s next moves. However, there are enough important developments that I thought it made sense to write a quick T2108 Update. The market once again looks like it is bursting at the seams, and opportunistic traders should be ready to pounce if you have not already been doing so.
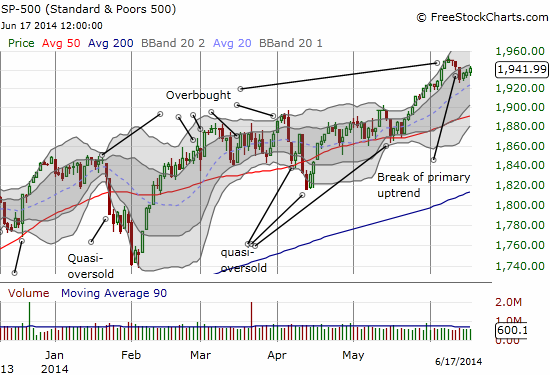
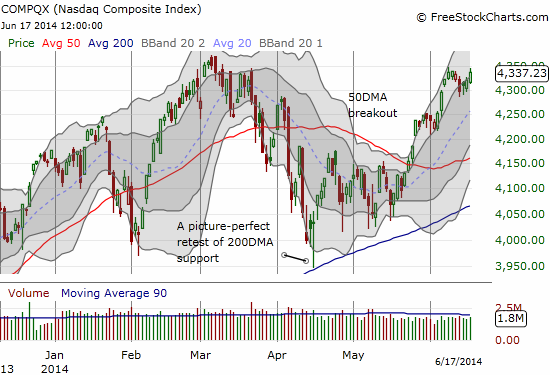
The bear rumblings I thought I heard more loudly last week have pretty much died into another whimper. The bearish setup barely remains valid on the S&P 500 (SPDR S&P 500 (ARCA:SPY)) and the NASDAQ is already poised for a fresh run-up.
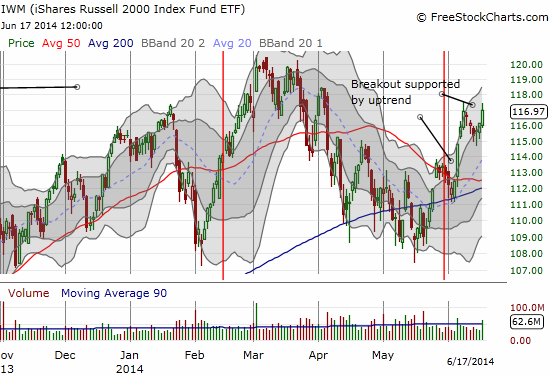
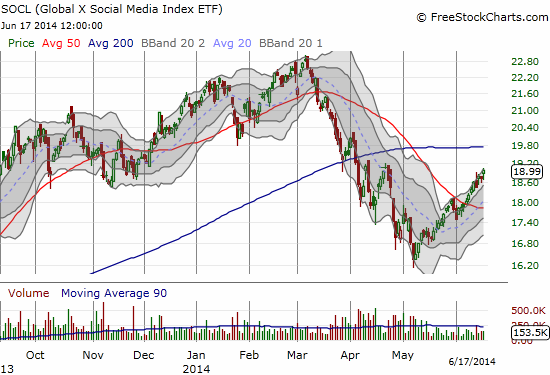
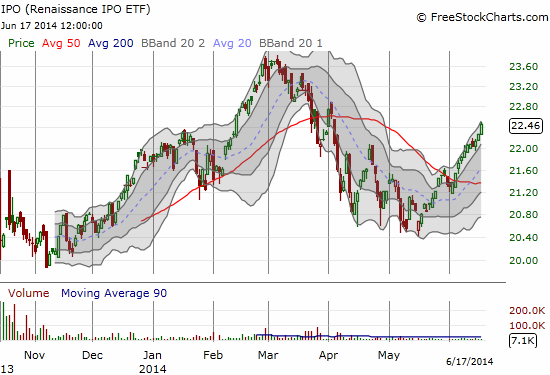
While the indices have essentially gone nowhere in almost two weeks, I have seen a LOT of bullish setups in individual stocks. I do not have firm numbers to quantify the explosion, just an observation that so many of the stocks I watch and trade are making powermoves that I can barely monitor all the action. Three indices provide some hints of what is going on just below the market’s surface: iShares Russell 2000 (ARCA:IWM), Global X Social Media Index ETF (Global X Social Media Index (NASDAQ:SOCL), and Renaissance IPO ETF (IPO).
Remember the angst over how IWM was going to lead the market lower? I didn’t think so. IWM is now on a bullish breakout and run-up on a fresh uptrend pattern. In an earlier post I demonstrated how the rare divergence of IWM from iShares Russell 1000 (NYSE:IWB) favored an IWM recovery, not an IWB sell-off.
SOCL and IPO were also crushed when high multiple and momentum stocks fell out of favor. Since the lows in May, these two representatives of high-octane trading have steadily marched higher in almost a straight line. They have been all but oblivious to macro headlines and the struggle of the larger indices to make progress.
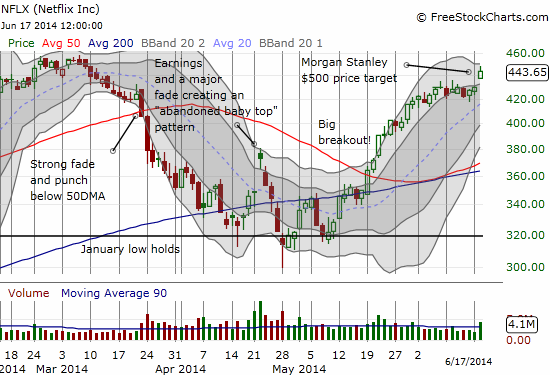
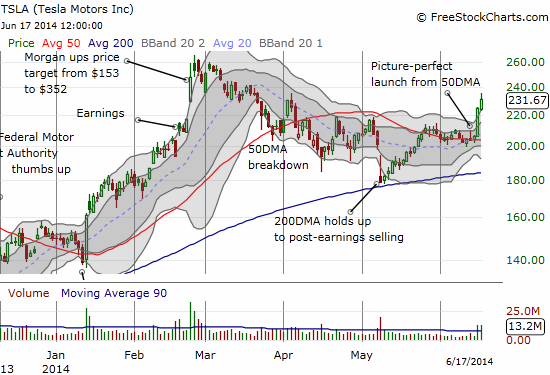
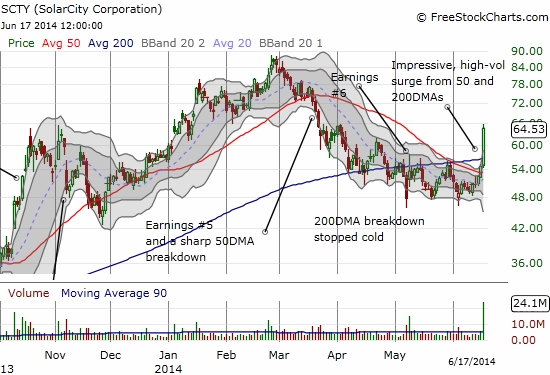
If these three indices are steadily marching higher, then you know some related stocks must be on fire. However, I want to point to two of the stocks carrying the banner for high-octane trading: Netflix (NASDAQ:NFLX) and Tesla (NASDAQ:TSLA). Both stocks are experiencing major breakouts. NFLX’s breakout is older and much more persistent right now. Its move culminated in an upgrade on Tuesday, June 17 by Morgan Stanley to Overweight and a $500 price target. Recent pops in Salesforce.com (NYSE:CRM) and Solar City (NASDAQ:SCTY) are similarly impressive. All four stocks have shown an INCREASE in trading volume on the buying – a very bullish sign for all of them.
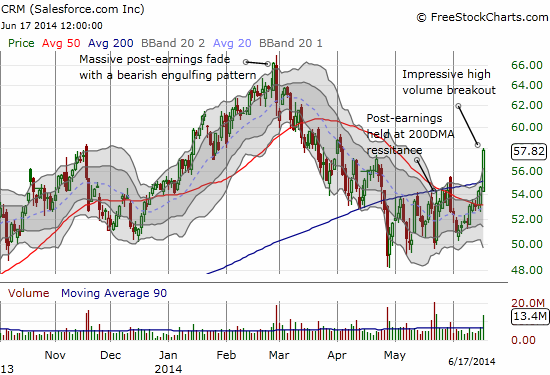
Salesforce.com chops its way to a breakout (note the higher lows even as the 200DMA served as resistance)
My trading record is mixed on these. I nailed CRM with call options and got taken out on the pop as my price target was hit in a day. SCTY was a complete whiff as I failed to get a trade in even as I saw the potential pop forming with the convergence of the 50 and 200DMAs.
I have written several times about my NFLX ups and downs. I found it hugely ironic that I got taken out on a 405/420 call spread expiring this Friday with the Morgan Stanley upgrade because this is the kind of trade I aggressively and very bullishly promoted ahead of April earnings. Now, the nice profits from this trade are just helping nurse a short position that is now a bet that NFLX will not make new highs. As you can imagine I recycled some of my recent profits into a NEW call spread! Ditto mix on TSLA. Monday’s pop caught me flat-footed as I was getting ready to set up another hedged trade. I rushed into call options on Tuesday’s positive open without a second thought. Good thing!
Daily T2108 vs the S&P 500
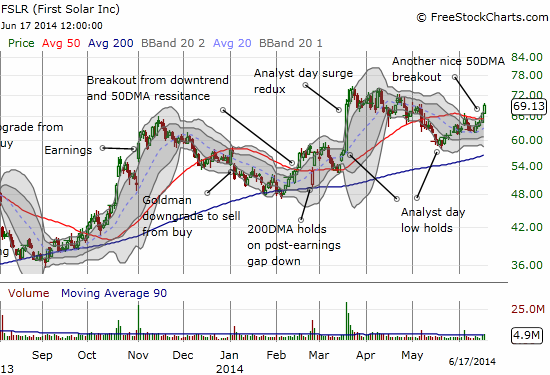
I was not fast enough to join the fun in Solar City, but I did think fast enough to look through my list of solar socks and make a trade in First Solar (NASDAQ:FSLR). I have not traded the stock in a very long time. (I am very overdue writing a fresh piece on the business).
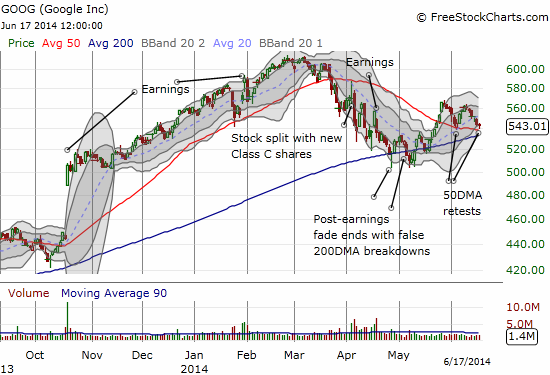
Finally, there is Google (NASDAQ:GOOG). Two weeks ago, I wrote “Don’t Worry About Google’s Chart Just Yet” in response to a technician’s bearish read of GOOG’s chart. The stock has provided some upside and downside excitement since then. It is now showing relative weakness even as it retests its 50DMA support for the second time since my post. I just missed buying a fresh call option at the lows of the day. I hope I do not miss another impressive pop… (Note how Google remains below its price where it split into different classes of shares).
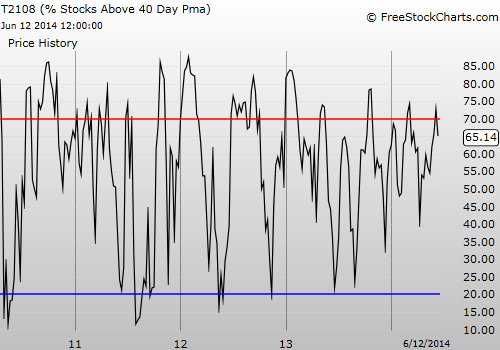
As you can tell, my approach to individual stocks has been much different than the general indices. The variety in individual stocks is nearly startling to me, and I have had to keep an open mind even as T2108 tells me to remain bearish on the S&P 500. T2108 remains in a bearish position since it recently dropped from overbought conditions. A return to overbought will start the clock again on considering the possibilities for an extended overbought run. Bearish traders should prepare to stop out, and tend-followers and bulls who stopped out earlier should get ready to jump back into the fray. Perhaps the Federal Reserve will provide the determining catalyst…
Daily T2108 vs the S&P 500
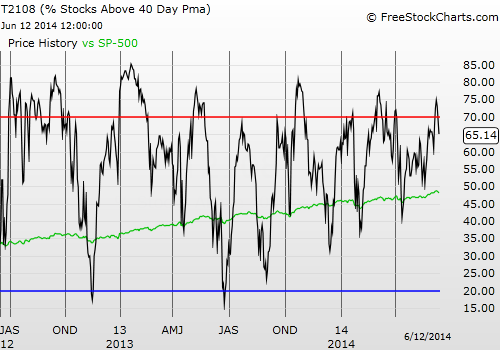
Black line: T2108 (measured on the right); Green line: S&P 500 (for comparative purposes)
Red line: T2108 Overbought (70%); Blue line: T2108 Oversold (20%)
Weekly T2108
Be careful out there!
Disclosure: long NFLX call spread, short NFLX and TSLA shares, long TSLA call options

