FX Brief:
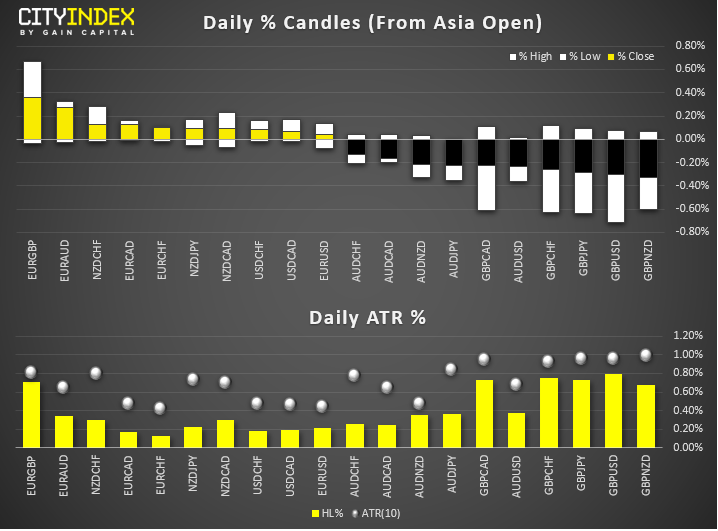
RBA appear on track to cut rates in 2020, with February being flagged as the meeting to “reassess the economic outlook”. With plenty of data between now and then (including CPI and 2x employment reports) it leaves plenty to move the needle between cut or hold.More positive news out for New Zealand saw business confidence and activity move to their highest levels this year. Whilst confidence is still pessimistic it has reduced over 40 points from multi-year low to strongly suggest a trough in confidence is in.Kudlow continues to peddle the China trade deal is “absolutely done” across the wires.A Reuters poll shows that 60% of economists questioned expect BOJ to pull back from their easy monetary policy as part of their next move.Price Action:
DXY continues to tread water around the broken, bullish trendline. A bearish hammer formed yesterday, so swing traders could consider shorts below 97.36 resistance. A break above here warns of a bear-trap. printed an elongated doji to suggest support sits around 1.3112. Whilst it leaves potential for a bounce near-term, a break below 1.3100 brings the 2019 lows into focus just above 1.3100 is teasing a break of Friday’s bearish outside candle. Given the growing expectations of a cut in February, its vulnerable to further downside – whether it be driven by weaker employment data on Thursday, or better than expected US data. A direct break below 0.8500USD/CHF’s decline has stalled above 0.9800. Ultimately, we see further downside as we head into the back of the year, although the volatility of candles around current levels shows a battle is commencing. So, there’s potential for a minor bounce before breaking lower.Equities Brief:
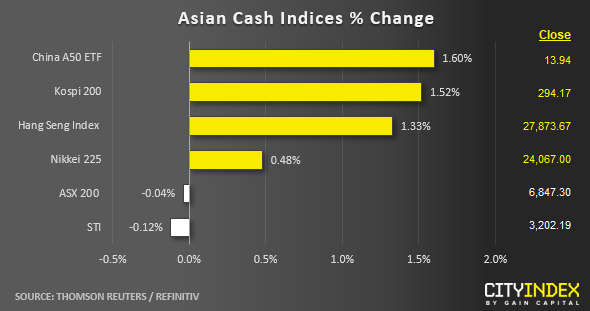
Key Asian stock markets are seeing the continuation of the festive cheer with gains of around 1.6% to 1.3% seen so far for China A50, South Korea’s Kospi 200 and Hong Kong’s on the backdrop of another fresh record highs printed on the benchmark U.S. stock indices; S&P 500, and .China’s state planning agency, the National Development & Reform Commission has commented that China has the confidence and conditions to achieve its full-year 2019 economic targets such as GDP growth of 6%-6.5%. In light of expected weaker future growth and uncertainties from the on-going trade tension with U.S, the agency reported that China will not resort to massive economic stimulus to ramp up infrastructure development projects, reiterated that it will increase pork and beef imports that is in line with an in - principal agreement with the U.S. to purchase significant amount of U.S. agricultural products under the “Phase One” trade deal.Several major benchmark Asian stock indices like the and the are facing tighter scrutiny on their compilation methodologies from European regulators under the new EU’s benchmark regulation (BMR) where such indices are expected to comply with its standards by end of 2021.However, the latest survey by the Asia Securities Industry and Financial Markets Association (ASIFMA), found out that Asian indices publishers have made little progress in meeting these BMR standards, a regulatory headache as the clock ticks closer to 2021.Price Action (derived from CFD indices):
Japan 225: Minor uptrend remains intact since the bullish breakout from its former 23650 medium-term range resistance. Short-term support now rests at 23770 for further potential push up to target the next intermediate resistance at 24400 (01 Oct 2018 swing high area & Fibonacci expansion cluster).Hong Kong 50: Inching higher to test its major resistance at 28200 (61.8% Fibonacci retracement of the previous decline from 03 May high to 15 Aug 2019 low & the descending trendline from 29 Jan 2018 all-time high), key short-term support now rests at 27400 (14 Dec 2019 minor swing low).Australia 200: In minor pull-back mode below the 6880/90 all-time high area towards the 6780 max 6740 key medium-term support before a potential upleg unfolds next.Germany 30: Minor uptrend remains intake since the bullish breakout from its “flag configuration” Key short-term support rests at 13250/200 (13 Dec 2019 minor swing low & the pull-back support of the “flag” former resistance) for a further potential push up to retest its current all-time high area of 13600.US SP 500: Minor uptrend remains intact with key short-term support now at 3177 (minor ascending trendline from 12 Dec 2019 low & Fibonacci retracement cluster) for a further potential push up to target 3220 resistance next (Fibonacci expansion & upper boundary of a minor ascending channel from 03 Dec 2019 low). Original Post