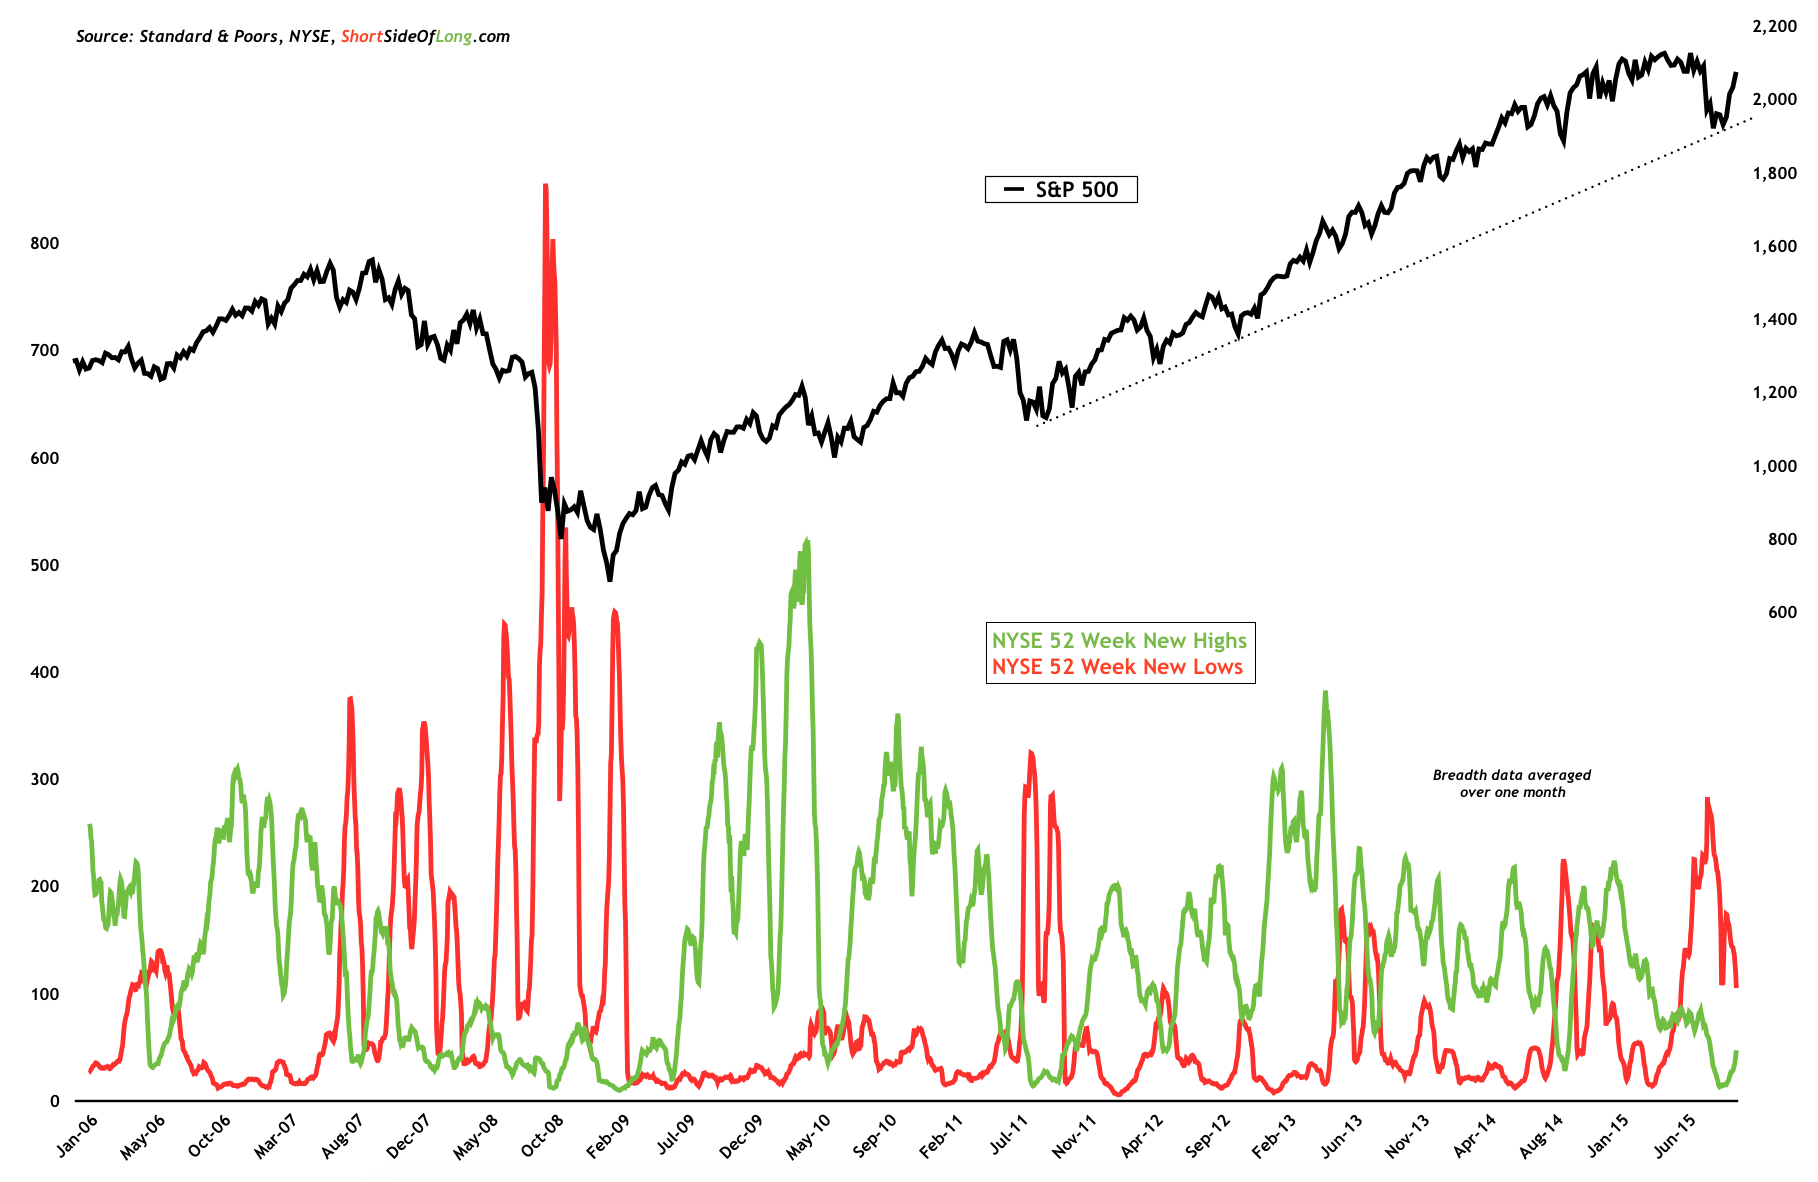
NYSE new highs are starting to rise, while new lows are retreating
 Source: Short Side of Long
It’s all about the central bank stimulus. The Federal Reserve should remain on hold, with bond market probability of a FOMC rate hike only 6% for the next week's meeting and 39% by year end. The ECB’s Mario Draghi has reloaded his bazooka, as he hinted of more stimulus to come on Thursday. And finally, on Friday, the PBoC cut interest rates yet again. All of these monetary measures, together with very low commodity prices, are attempting to stimulate the global economy.
Stock market breadth shows that the selling pressure peaked on 24th of August, just as we called the bottom, with the number of NYSE 52 week new lows hitting a high of 283 (when average over one month or 21 business days). This was the highest monthly number of new lows in four years, dating back to October 2011 bottom, which we were also remarkably lucky to call as well. In recent days, the number of 52 week new highs is starting to rise once again, signalling that breadth is improving.
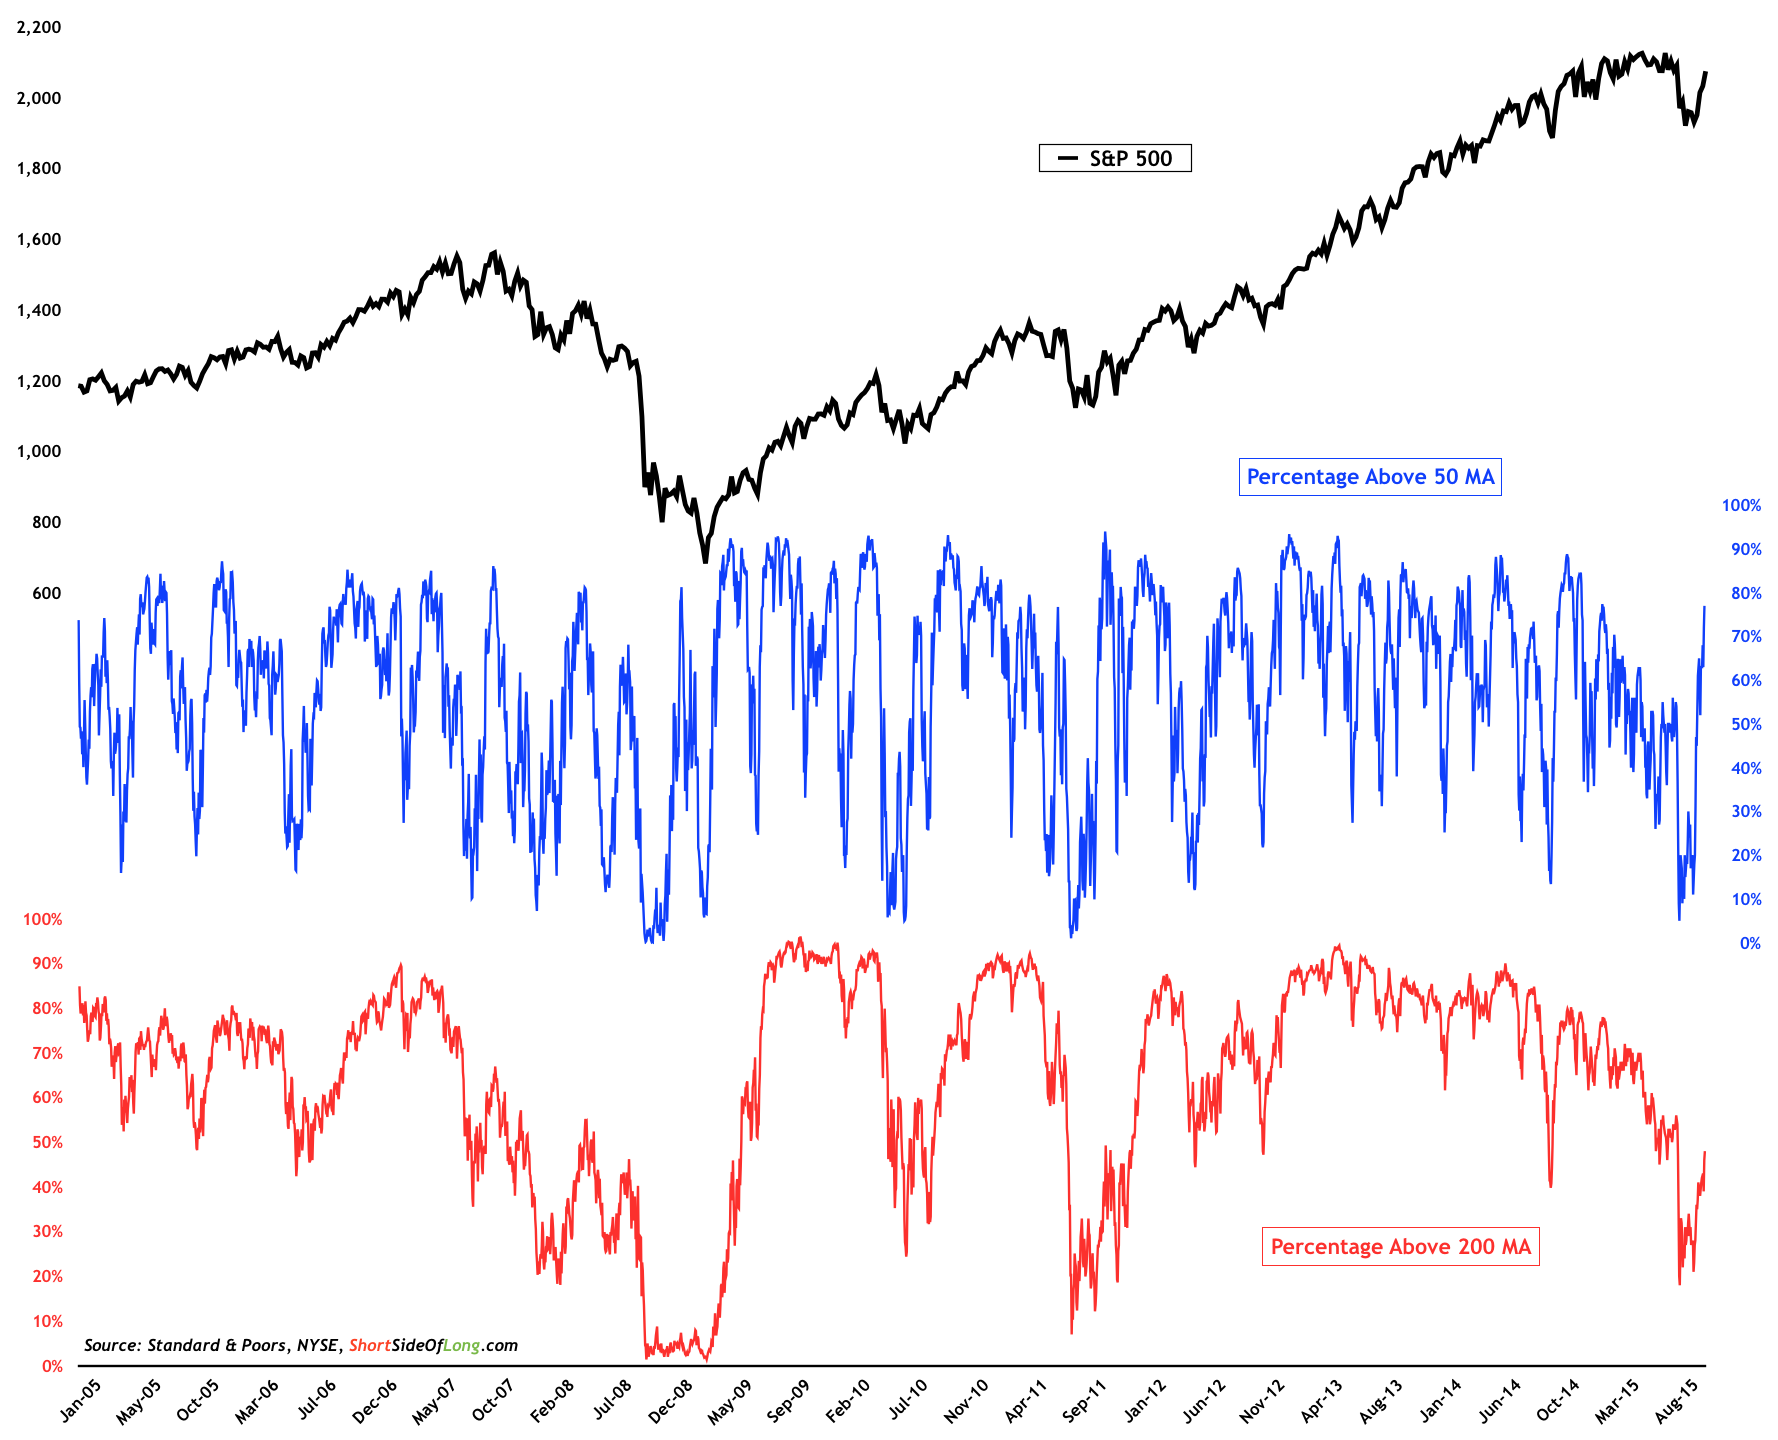
Improving breadth with majority of the stocks rising above 50 MA
 Source: Short Side of Long
Similar story can also be distinguished with the percentage of S&P components trading above their respective 50 day and 200 day moving averages. As of Fridays close, there were 77% of components or more than three quarters of the S&P 500, above their respective 50 day moving averages. In other words, a lot of the stock market has entered a short term uptrend. However, the technical damage hasn’t been healed completely just yet. There are still only 48% of companies within the major index trading above their respective 200 day MA, which means more then half of the S&P is still in a longer term downtrend.
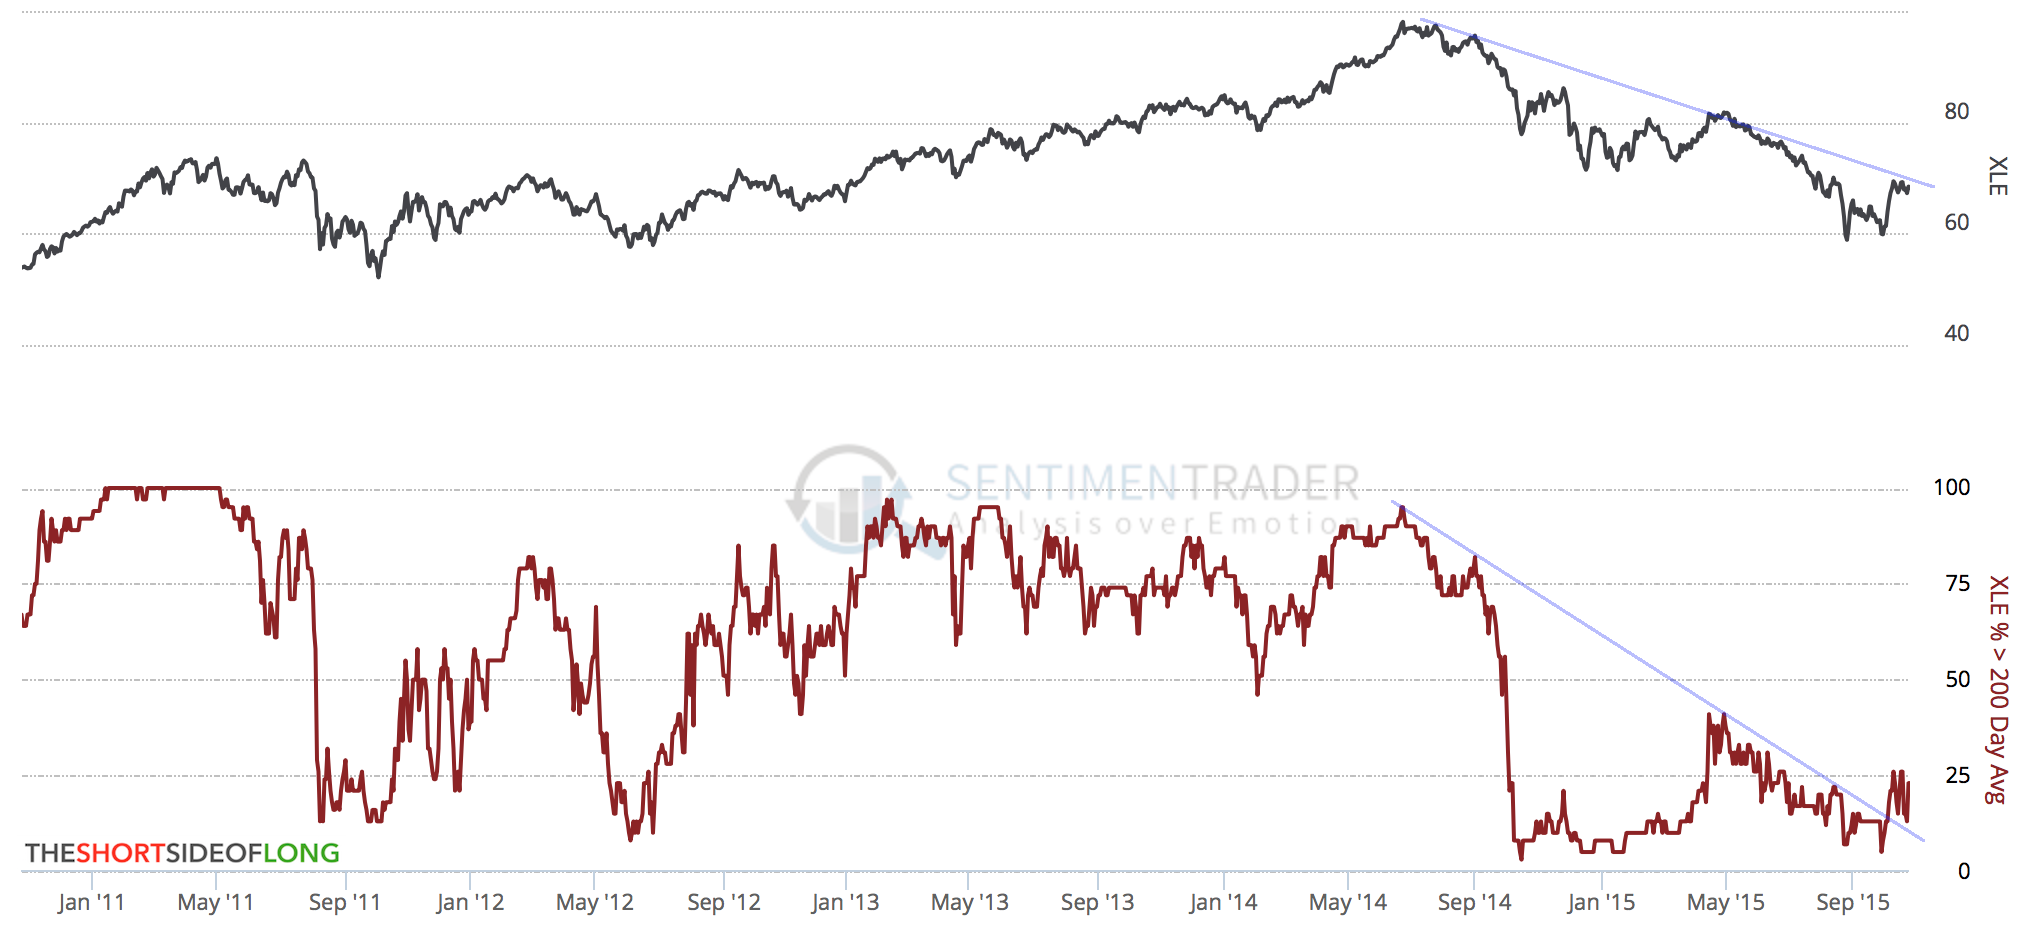
One of the major reasons why long term breadth is so weak is due to sectors such as Energy (via Energy Select Sector SPDR (N:XLE)), which have been completely decimated over the last year and half. Despite the fact that breadth participation remains weak, we are believers that the Energy sector has bottomed out. We see the sector as extremely oversold (buying opportunity) and believe that leading indicators and improvements signal more upside from here.
Energy sector could break out as breadth remains extremely oversold

