- SPX Monitoring purposes: Covered 6/19/18 at 2762.57 =gain .61%; Short SPX on 6/15/18 at 2779.42.
- Monitoring purposes Gold: Neutral.
- Long Term Trend SPX monitor purposes: Neutral.

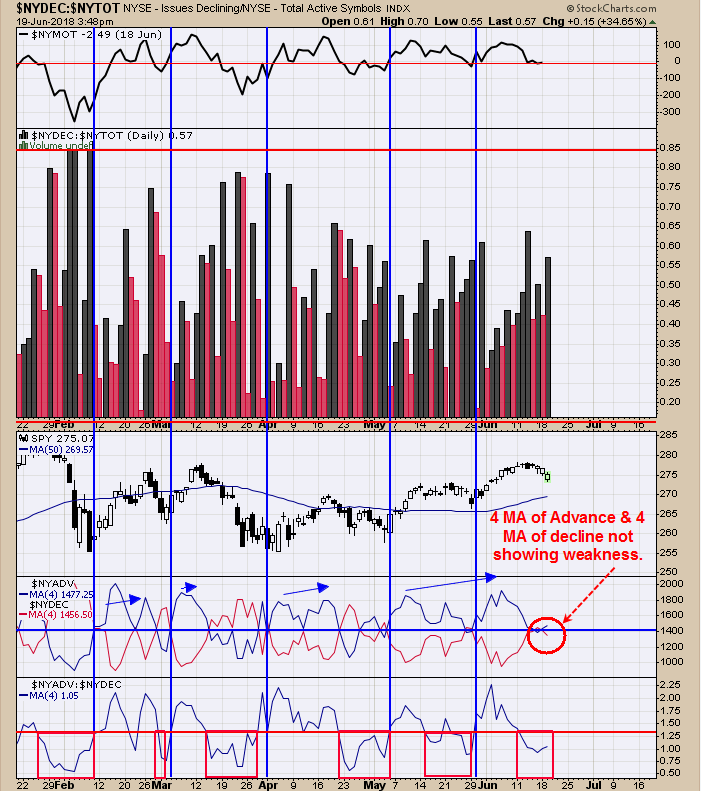
The above chart measures the momentum in the advance/decline line and helps to show when the market is getting stronger or weaker. The bottom window is the NYSE Advance/NYSE Decline issues with a 4 period MA. Readings below 1.25 have been a bearish sign for the market. Today, this indicator closed at 1.05 and up from yesterday and shows the market is getting stronger but still below 1.25. Next window up is the NYSE Advancing issues with 4 day average (blue) and NYSE declining issues with 4 day average (red). When the blue line is on top than an uptrend is in progress; when red line is on top then decline is in progress. Today, the blue line closed above the red line and is a bullish sign. Covered SPX short today = gain of 0.61%.

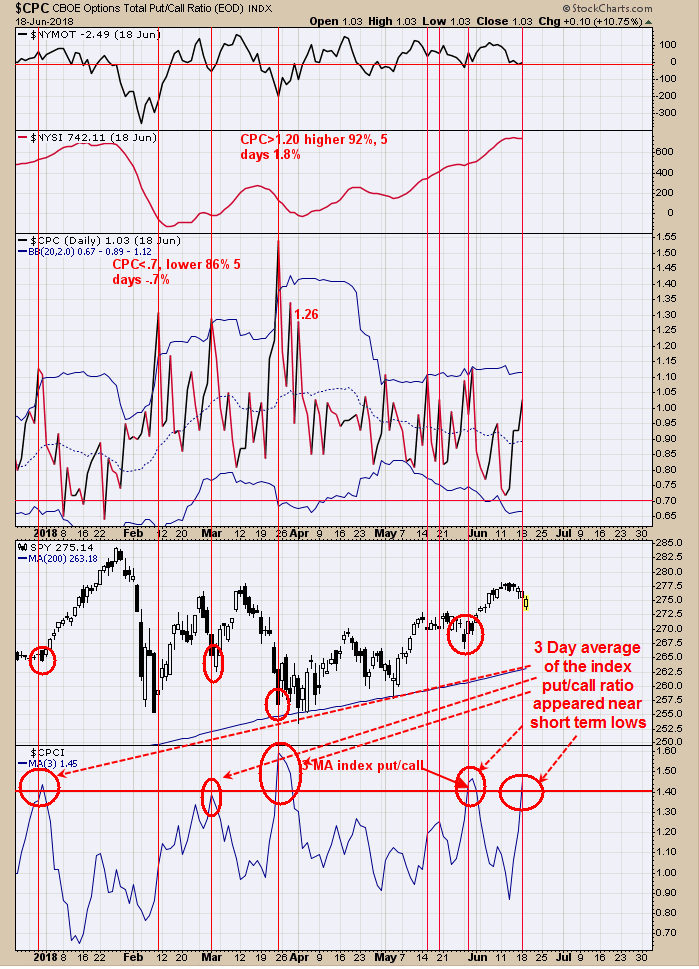
The bottom window is the three day average of the Index Put/Call ratio. Readings in the 1.40 range and higher came near lows in the SPX and yesterday’s low came in at 1.45. The index put/call ratio is updated hours after the close so we don’t have today’s reading. Market is not acting that weakly here. There is a study where Dow Jones is down five days in a row (which it was) and market higher within five days with an average gain of 1.21% 17 out of 17 times, and this study is active now. July 4 has been an important reversal date in the past (on most occasions) and a worthwhile move has come off that time period (two weeks away tomorrow). If the market is going down through to July 4, it's expected to have a bullish resolution and if it goes up, then a bearish one.

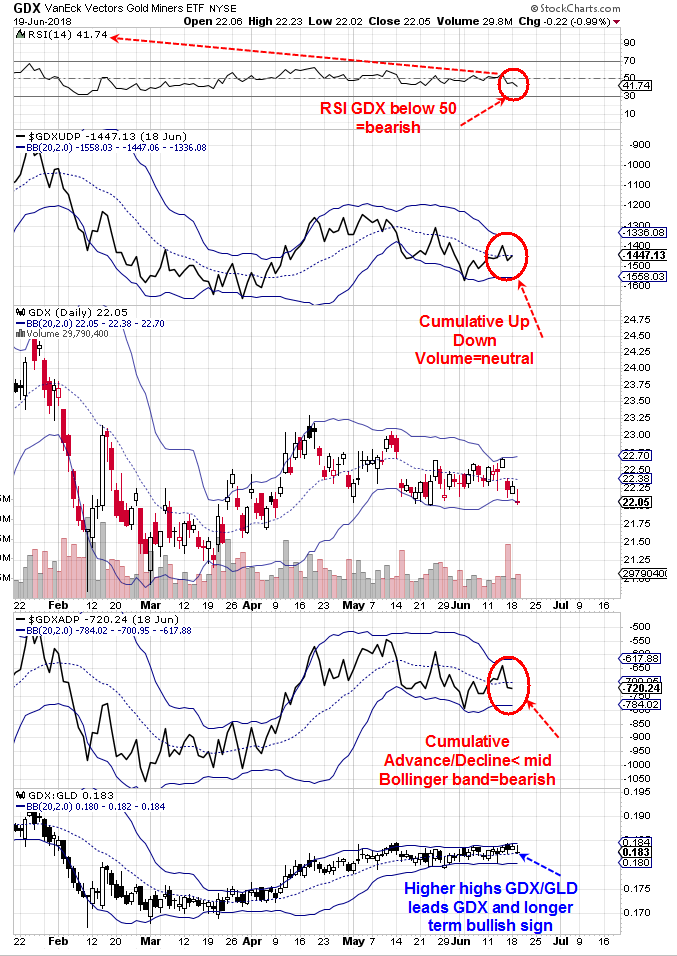
We have pointed out in the past, the longer term bullish signs for GDX on the weekly and monthly charts. When the daily turns bullish, a strong rally could be expected and that is the reason we have been looking at the daily time frame. So far, the dailys are still in the bearish mode. The bottom window is the GDX/GLD ratio which is showing bullish signs and is outperforming GDX and this ratio usually leads GDX and suggests a rally in GDX is not far off. Next window up is the Cumulative Advance/Decline which is below the mid Bollinger® band and bearish. Top window is the RSI for GDX which is below 50 and a bearish sign for GDX. A close above 50 will turn the trend back to bullish. Next window down is the cumulative Up Down Volume which is neutral and not giving a lot of information. In general the short term picture for GDX is still bearish. Being patient for now.
