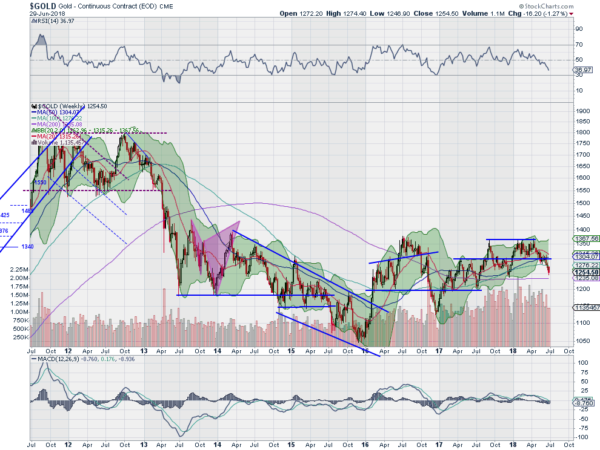
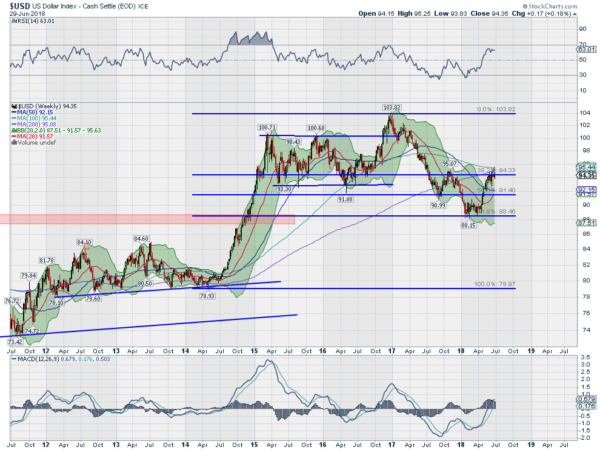
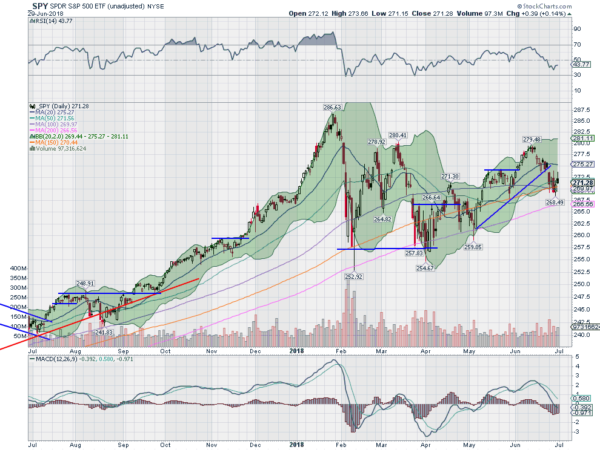
Last week’s review of the macro market indicators noted Summer had officially begun with the Solstice and left only one week in the second quarter. Stocks looked to enter the last week with a bit of weakness in the short term but remain strong in longer time frames. Elsewhere looked for Gold to continue lower while Crude Oil reversed and resumes the uptrend.
The US Dollar Index was pausing in its uptrend while US Treasurys continued to mark time moving sideways. The Shanghai Composite and Emerging Markets both continued to look weak and ready for more downside. Volatility looked to remain subdued keeping the bias higher for the equity index ETFs SPY (NYSE:SPY), iShares Russell 2000 (NYSE:IWM) and PowerShares QQQ Trust (NASDAQ:QQQ). Their charts showed consolidation or minor pullbacks in the short term with the IWM and QQQ near all-time highs but the SPY continuing to lag.
The week played out with Gold continuing to move lower, finding support Friday and ending with a small bounce while Crude Oil moved higher all week. The US dollar bounced around a little but basically was unchanged on the week while Treasuries moved higher after a gap up Wednesday. The Shanghai Composite continued down to the 2016 lows and found support while Emerging Markets also found support mid week and bounced.
Volatility popped Monday but had fallen back near unchanged by the end of the week, keeping the bias higher for equities. The Equity Index ETFs started the week heading lower, but all found their footing Thursday and moved back higher Friday. All 3 finished down for the week, instilling some caution, and the IWM and QQQ printing potential topping candles for the month. What does this mean for the coming week? Lets look at some charts.
Gold Daily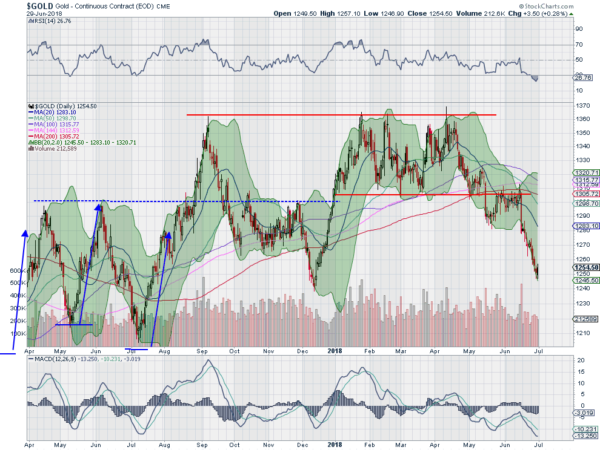
Gold came into the week in a downtrend and continued lower Monday. It finally found support as Friday began and bounced slightly to end the week. The daily chart shows the RSI is now in oversold territory and the MACD reaching extreme low levels as the price approaches the December 2017 lows. Perhaps a pause is in order in the short term.
The weekly chart continues to show weakness though with the price approaching the 200 week SMA from above. The RSI on this time frame is now in the bearish zone and falling with the MACD negative and falling. This bodes for more downside. There is support at 1245 and 1215 then 1200. Resistance higher is at 1265 and 1278 then 1300. Possible Pause in Downtrend.
West Texas Intermediate Crude Daily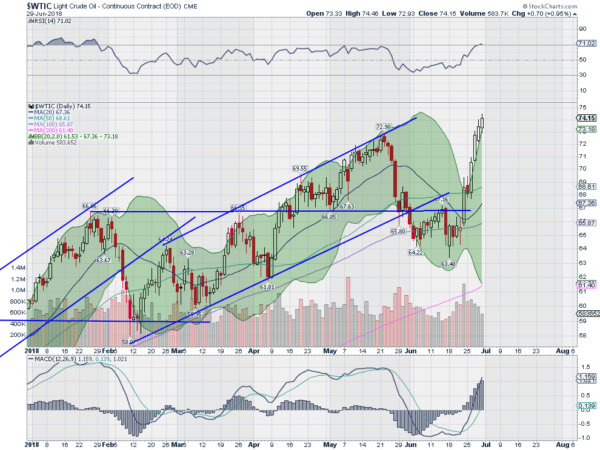
West Texas Intermediate Crude Weekly
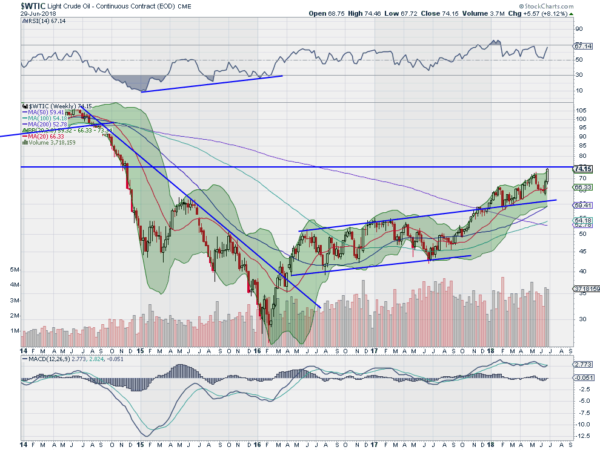
Crude Oil started the week after a Friday break of resistance to the upside on a strong candle. It paused Monday to catch its breathe and then moved higher all week, ending at a more than 3½ year high. The daily chart shows the price outside of the Bollinger Bands® for 4 consecutive days, suggesting a pause is in order. The RSI is rising and bullish though and the MACD moving up. Neither are extreme.
The longer time frame shows Crude closing in on some minor resistance from late 2014. The Bollinger Bands® are opening to the upside on this time frame with the MACD about to cross up and the RSI rising and bullish. No need to reset on this time frame. There is resistance at 75 and then 83 to the upside. Support lower comes at 72.80 and 71 then 69.50 and 66.50 before 65 and 62.50. Uptrend Continues.
US Dollar Index Futures Index Daily
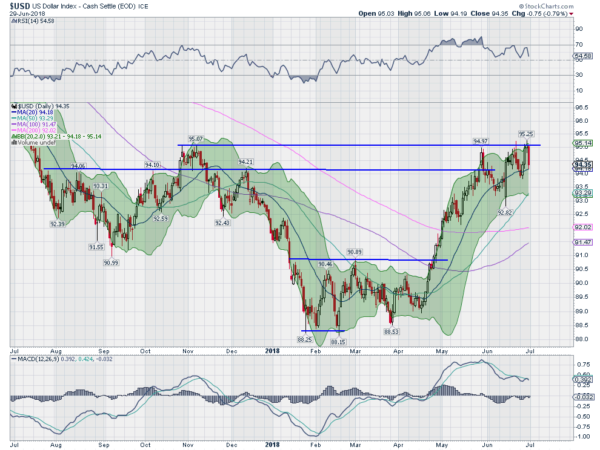
The US Dollar Index was pulling back in its latest move higher when the week started. It continued Monday but found support and rallied to retest resistance by Thursday. But it could not break through and pulled back Friday. The daily chart shows the failed attempt to break out over the November high with the RSI bullish and rising and the MACD about to cross up.
The weekly chart shows the cross of the 100 and 200 week SMA’s as providing some difficulty to move higher. The RSI is strong and rising though with the MACD rising and positive. There is resistance at 95 and 96.50 then 97.40 and 98.30 before 99. Support lower comes at 94 and 93 then 92 and 91.40. Pause in Uptrend.
iShares 20+ Year Treasury Bond (NASDAQ:TLT) Daily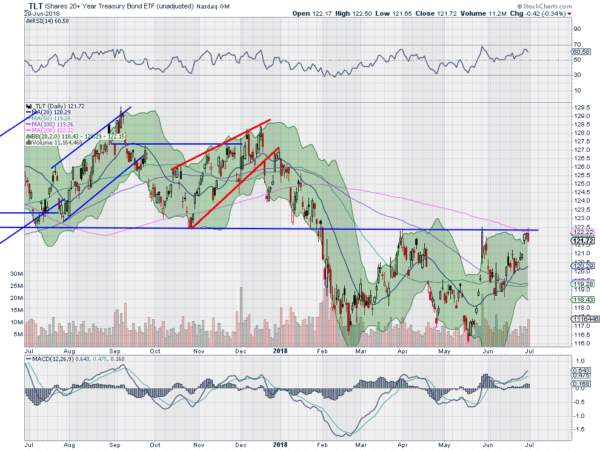
iShares 20+ Year Treasury Bond (TLT) Weekly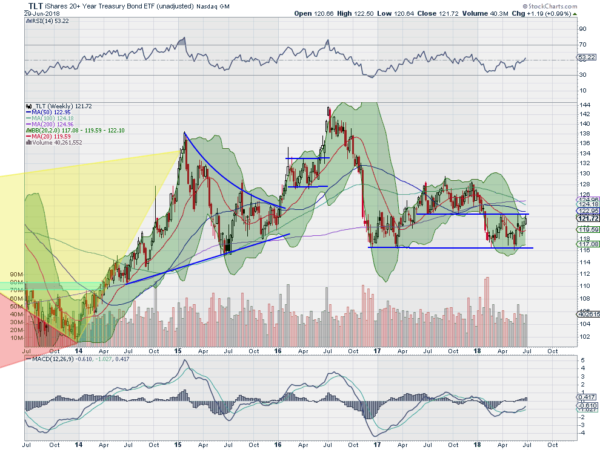
US Treasuries came into the week holding over their 20 day SMA and stuck in a broad consolidation. Monday and Tuesday did nothing to change that view and then they gapped higher Wednesday. Small gains the rest of the week saw them end at the 200 day SMA and resistance at what was prior support. Then it pulled back late Friday. The daily chart shows the RSI bullish and rising with the MACD positive and moving up.
On the longer time frame the RSI is trying to move over the mid line and up into the bullish zone. The Bollinger Bands® had squeezed and are now opening giving some promise to a continuation higher. The MACD is rising towards being positive. There is resistance higher at 122 then 123.25 and 124.25 then 125.25 and 127. Support lower comes at 120.25 then 118.20 and 116.20. Possible Break of Resistance in Uptrend.
Shanghai Composite (SSEC) Daily
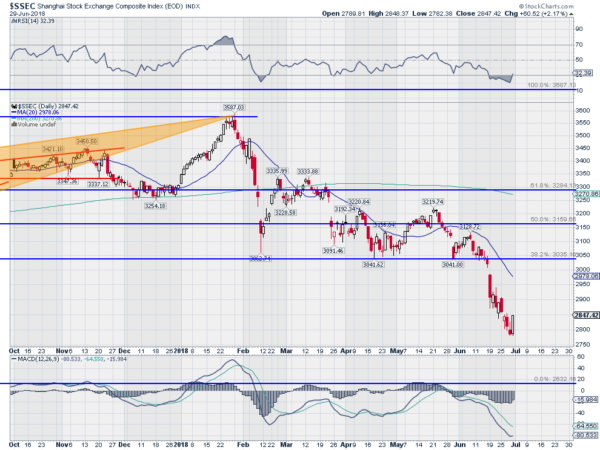
Shanghai Composite (SSEC) Weekly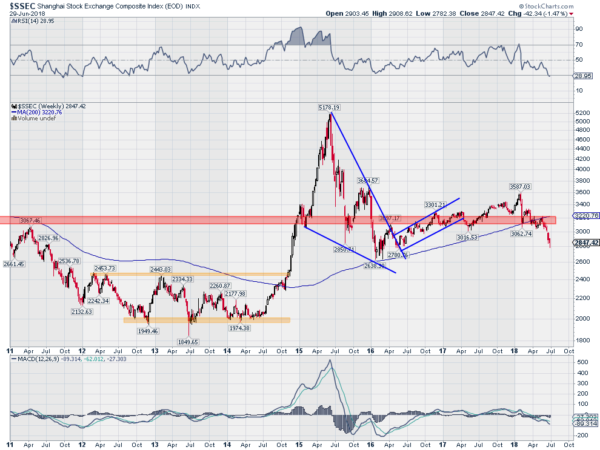
The Shanghai Composite was in a free fall as the week began. That continued with it dropping through Thursday’s close before getting a bounce Friday. Along the way it retested the 2 year lows. The daily chart shows it oversold with the RSI near 20 and the MACD at an extreme low. Perhaps time for a pause in the downtrend.
The weekly chart is also now in oversold territory with the RSI falling below 30 and the MACD falling and negative. The MACD is not extreme on this time frame though. The 2016 low is now not far away. There is support at 2800 and 2650 then 2450. Resistance comes above at 2900 and 2940 then 3000 and 3040 before 3100. Possible Pause in the Downtrend.
iShares MSCI Emerging Markets (NYSE:EEM) Daily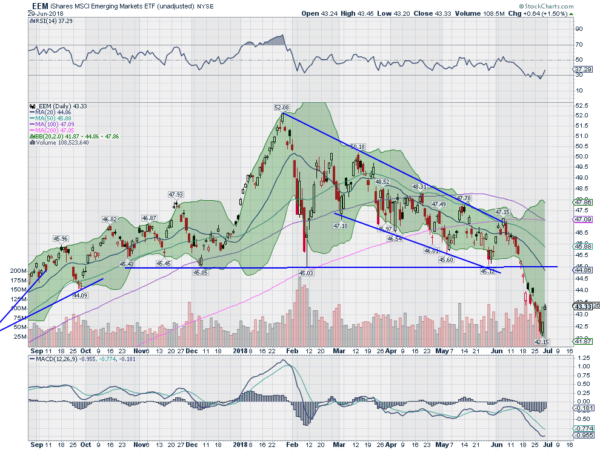
iShares MSCI Emerging Markets (EEM) Weekly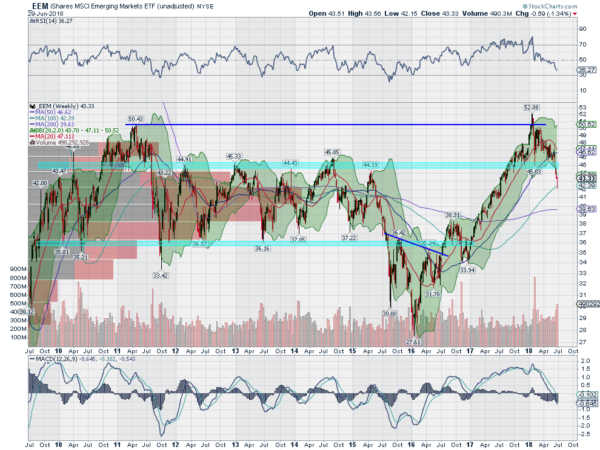
Emerging Markets had bounced to end the prior week giving hope for a reversal. But Monday brought a gap down and continuation with the bottom settling in near the open Thursday. They rose Thursday and continued higher Friday, but still ended the week lower. The daily chart shows the possible reversal off of a nearly 1 year low with the RSI turning back up and the MACD also turning higher. Both remain in the bearish zone though.
On the longer time frame the drop found support at the 100 week SMA. This was just beyond a 38.2% retracement of the move higher off of the January 2016 low to the January 2018 top. The RSI remains headed lower in the bearish zone with the MACD just crossing below zero. There is support lower at 42.25 and 41 then 40 and 38.90 before 38. Possible Reversal in the Downtrend.
VIX Daily
VIX Weekly
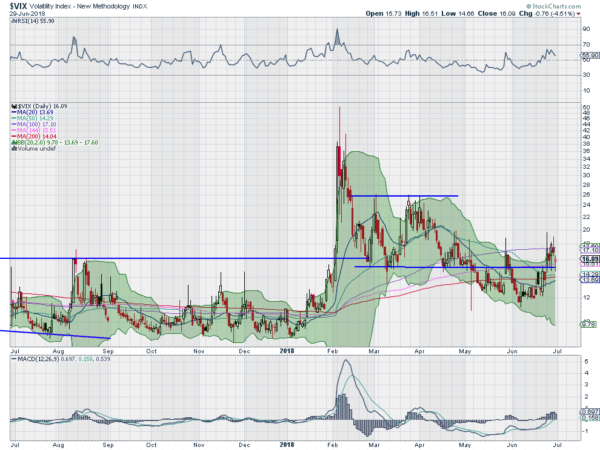
The Volatility Index started the week with a push to the upside and a run nearly to 20. It fell back intraday under the 200 day SMA and then settled there Tuesday. Wednesday saw another probe higher, with this one closing over the 200 day SMA for the first time in 2 months. It pulled back slightly Wednesday and then dropped back Friday to finish the week slightly higher. The daily chart has the RSI pulling back and the MACD leveling, both in bullish territory.
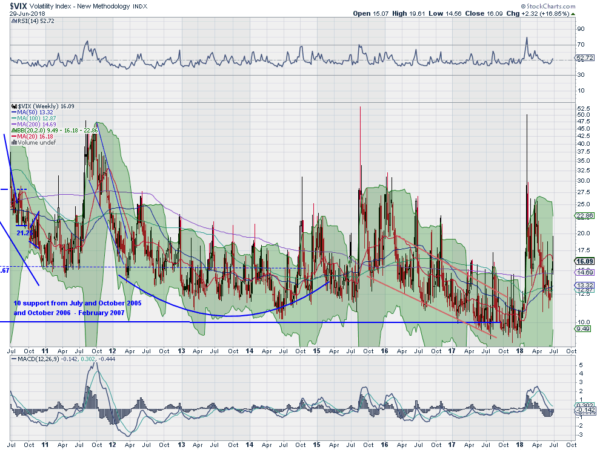
The weekly frame shows a move slightly higher after a probe to the upside failed leaving a long upper shadow. The RSI is rising up off of the mid line with the MACD turning to cross up. There is resistance at 18 and 22 then 26 and 30. Support lower comes at 12.40 and 11.50 then 10. Low Volatility with a Risk of Movement Higher.
The information in this blog post represents my own opinions and does not contain a recommendation for any particular security or investment. I or my affiliates may hold positions or other interests in securities mentioned in the Blog, please see my Disclaimer page for my full disclaimer.

