US exports of pork to Mexico is declining. Will the LHOG continue sliding?
US exports of pork to Mexico were 232,392 metric tons in the first four months of 2019, 18% down compared to the same time period a year ago, according to the US Department of Agriculture. Lower export demand is bearish for pork prices. At the same time the flooding in Midwest is expected to negatively impact corn and soybean crops, which are main feed for pigs. And tighter feed supply is an upside risk for hog prices.

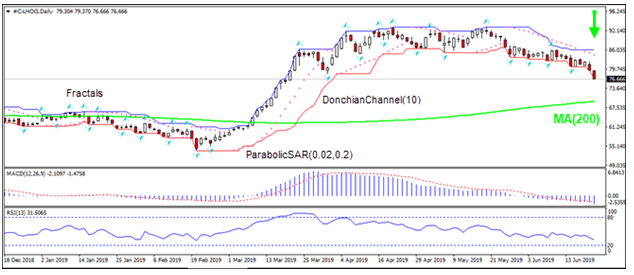
On the daily timeframe the LHOG: D1 is falling toward the 200-day moving average MA(200).
- The Parabolic indicator gives a sell signal.
- The Donchian channel indicates downtrend: it is widening down.
- The MACD indicator gives a bearish signal: it is below the signal line and the gap is widening.
- The RSI oscillator is falling but has not breached into the oversold zone.
We believe the bearish momentum will continue after the price breaches below the lower boundary of Donchian channel at 76.65. This level can be used as an entry point for placing a pending order to sell. The stop loss can be placed above the upper Donchian boundary at 86.06. After placing the order, the stop loss is to be moved every day to the next fractal high, following Parabolic signals. Thus, we are changing the probable profit/loss ratio to the breakeven point. If the price meets the stop loss level (86.06) without reaching the order (76.65), we recommend cancelling the order: the market has undergone internal changes which were not taken into account.
Technical Analysis Summary
| Order | Sell |
| Sell stop | Below 76.65 |
| Stop loss | Above 86.06 |
Market Overview
US stocks end week solidly higher
Dollar weakening continued after weak manufacturing and services PMI readings
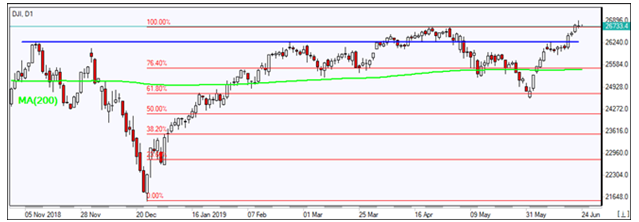
US stock market pulled back on Friday on weak data. The S&P 500 slid 0.1% to 2950.46, rallying 2.2% for the week.Dow Jones industrial slipped 0.1% to 26719.13. The Nasdaq lost 0.2% to 8031.71. The dollar weakening continued at previous session pace as data showed manufacturing and services sectors activities slowed in May, while existing home sales rose. The live dollar index data show the ICE (NYSE:ICE) US Dollar index, a measure of the dollar’s strength against a basket of six rival currencies, fell 0.5% to 96.16 and is lower currently. Futures on US stock indices point to mixed openings today.

FTSE 100 loss leader among European indexes
European stocks ended lower on Friday despite better than expected German and French purchasing manager surveys results. Both the GBP/USD and EUR/USD continued their advance with euro higher currently while Pound reversing lower. The Stoxx Europe 600 Index lost 0.4% Friday led by healthcare shares. The DAX 30 slipped 0.1% to 12339.92. France’s CAC 40 slid 0.1% and UK’s FTSE 100 lost 0.3% to 7345.78.
Nikkei lags behind Asian indexes
Asian stock indices are rising today after report China’s President Xi Jinping will attend the G-20 summit in Japan this week. Nikkei added 0.1% to 21285.99 with yen slide against the dollar intact. China’s markets are gaining: theShanghai Composite Index is up 0.2% and Hong Kong’s Hang Seng Index is 0.2% higher. Australia’s All Ordinaries Index turned 0.2% higher despite the Australian dollar’s accelerating climb against the greenback.
Brent steady
Brent futures prices are steady today. Prices ended higher on Friday despite Baker Hughes report the number of active U.S. drilling rigs edged up by 1 to 789, following two consecutive weeks of declines: Brent for August settlement rose 1.2% to close at $65.20 a barrel Friday, gaining 5.1% for the week.
