“Markets are slowly becoming more and more immune to these types of events.”
132 innocent people murdered at dinner, a show and the football, and markets don’t even bat an eye lid. The world we live in…
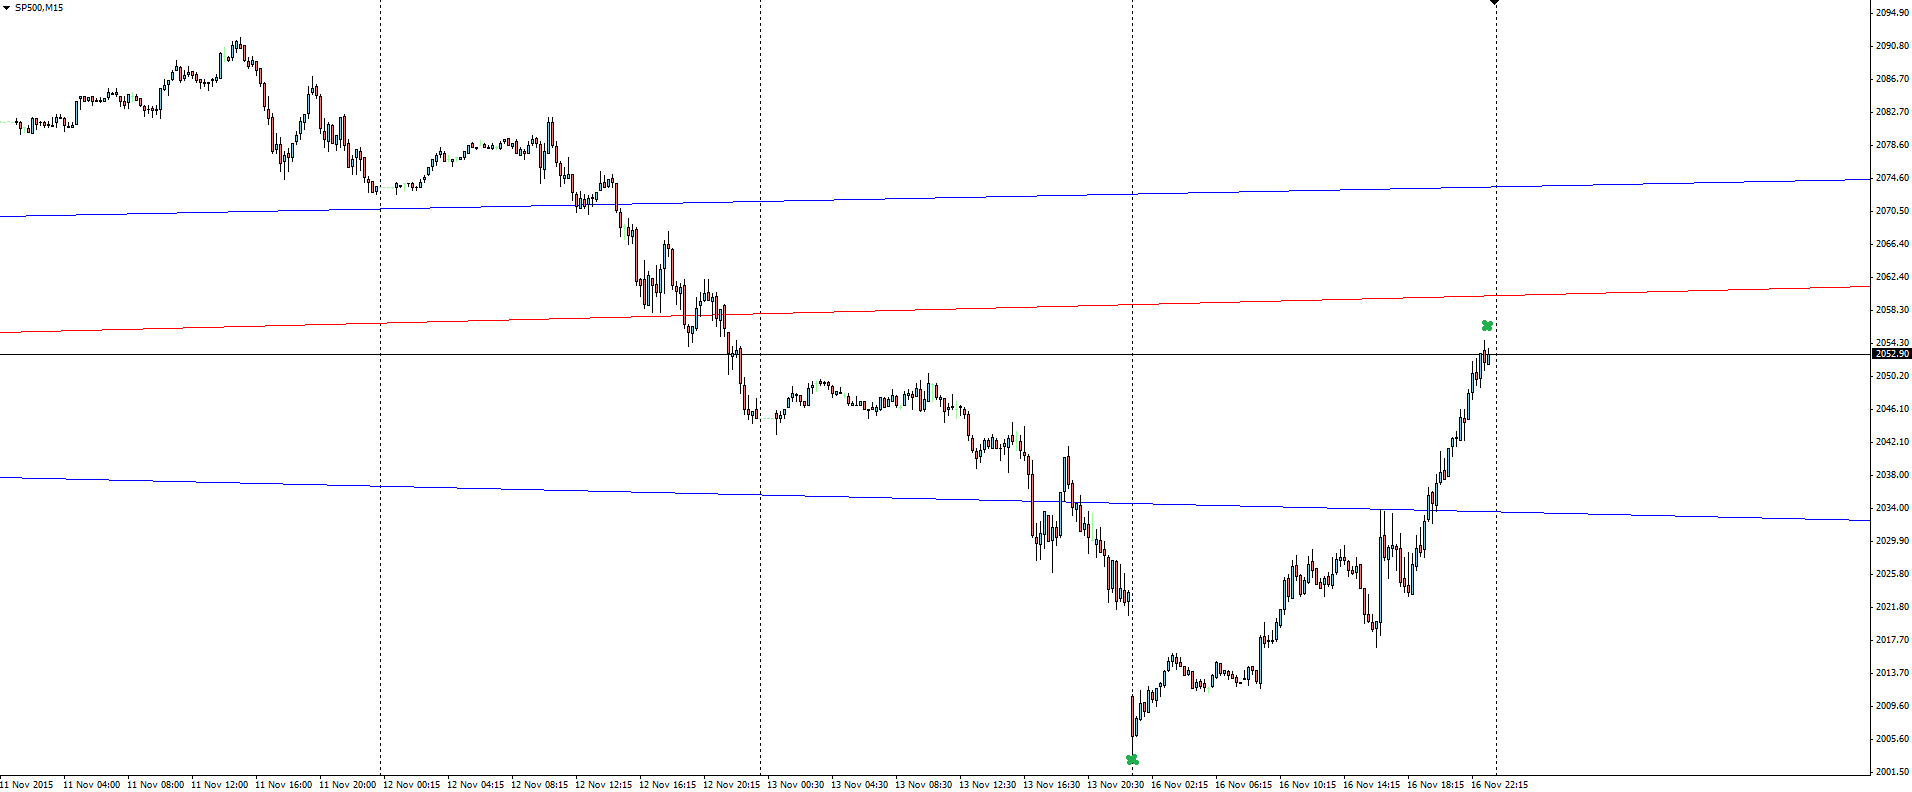
Well that’s not true, the S&P 500 did gap down but from there ripped through handle after handle to close well above even Friday’s open. Terrorism like this in major Western capital cities is unfortunately now just part of life. Life that goes on.
SP500 15 Minute:
Click on chart to see a larger view.
We spoke in yesterday’s Je suis Paris blog about expecting normal service to resume quite quickly and that’s what we saw in stocks with the eyes of Wall Street instead fixed firmly on US rate hike expectations for December.
The SP500 has chopped through all of the most recent technical levels that we’ve been watching, but the index just seems to have that relentless buying power behind it. I don’t know what else to say about this one, and posting a longer term chart seems a little useless.
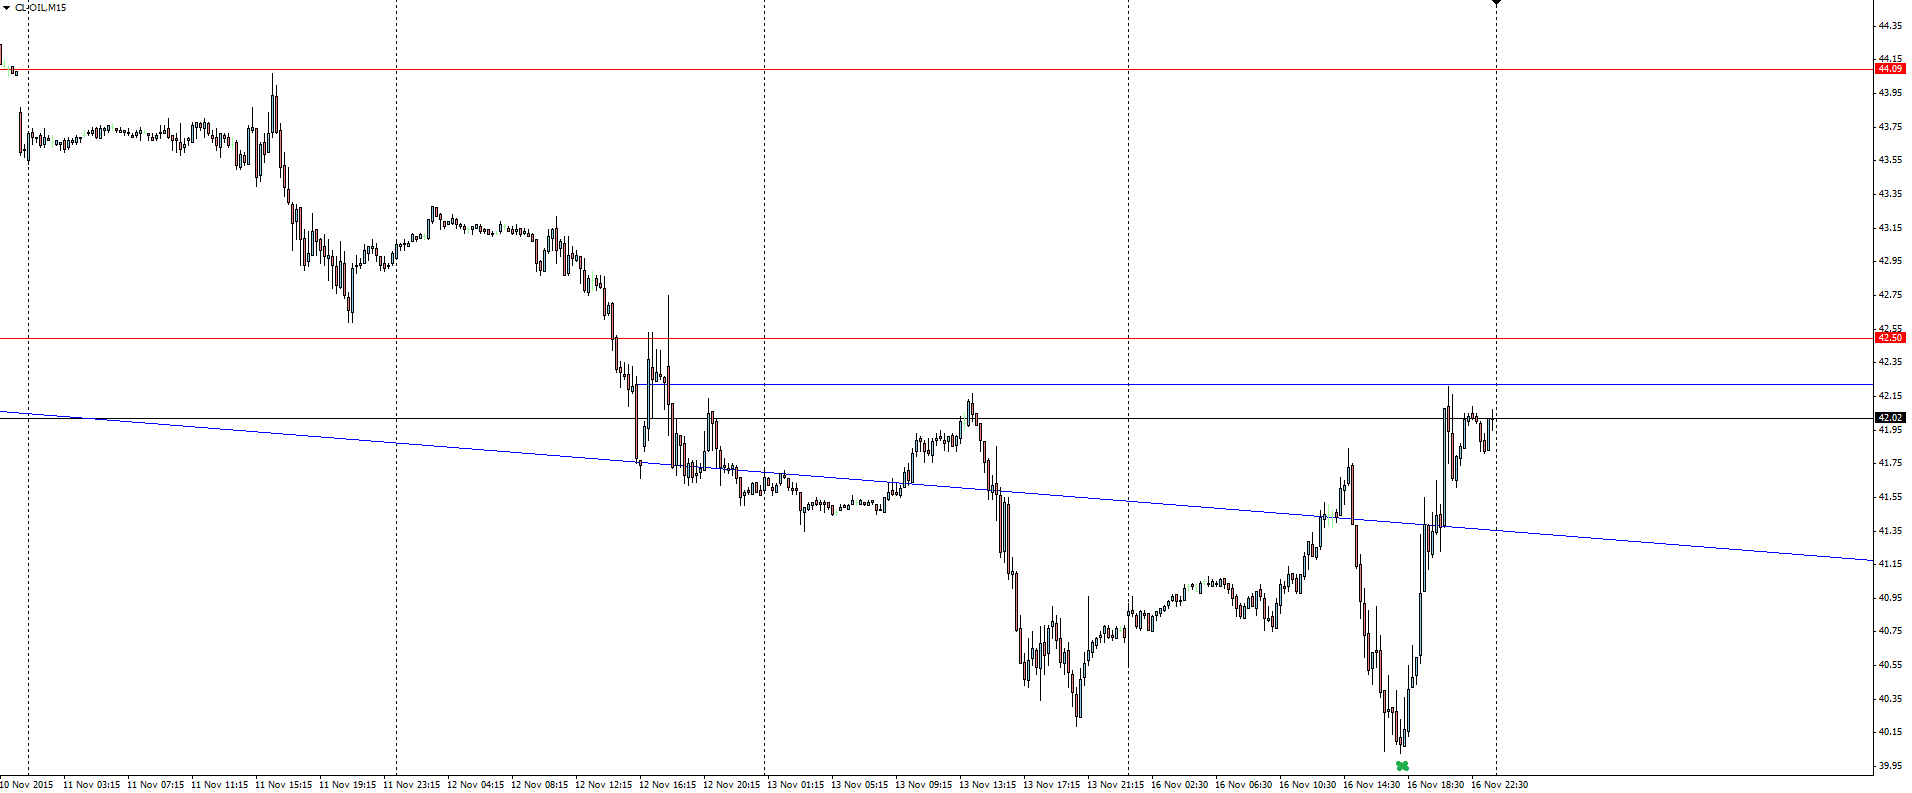
OIL 15 Minute:
Click on chart to see a larger view.
Oil was another market in the spotlight overnight, with the story of French air strikes intensifying over Syria in retaliation for the Paris attacks pushing prices up. Commodities have been struggling of late, as highlighted in yesterday’s gold and silver Technical Analysis blog post.
Oil drops on air strikes in the Middle East? Nothing changes! Looking at that chart, I just can’t make a single case to be getting long oil. That is a push back into a sell zone within a huge bearish trend.
———
On the Calendar Tuesday:
AUD Monetary Policy Meeting Minutes
NZD Inflation Expectations q/q
GBP CPI y/y
EUR German ZEW Economic Sentiment
———-
Chart of the Day:
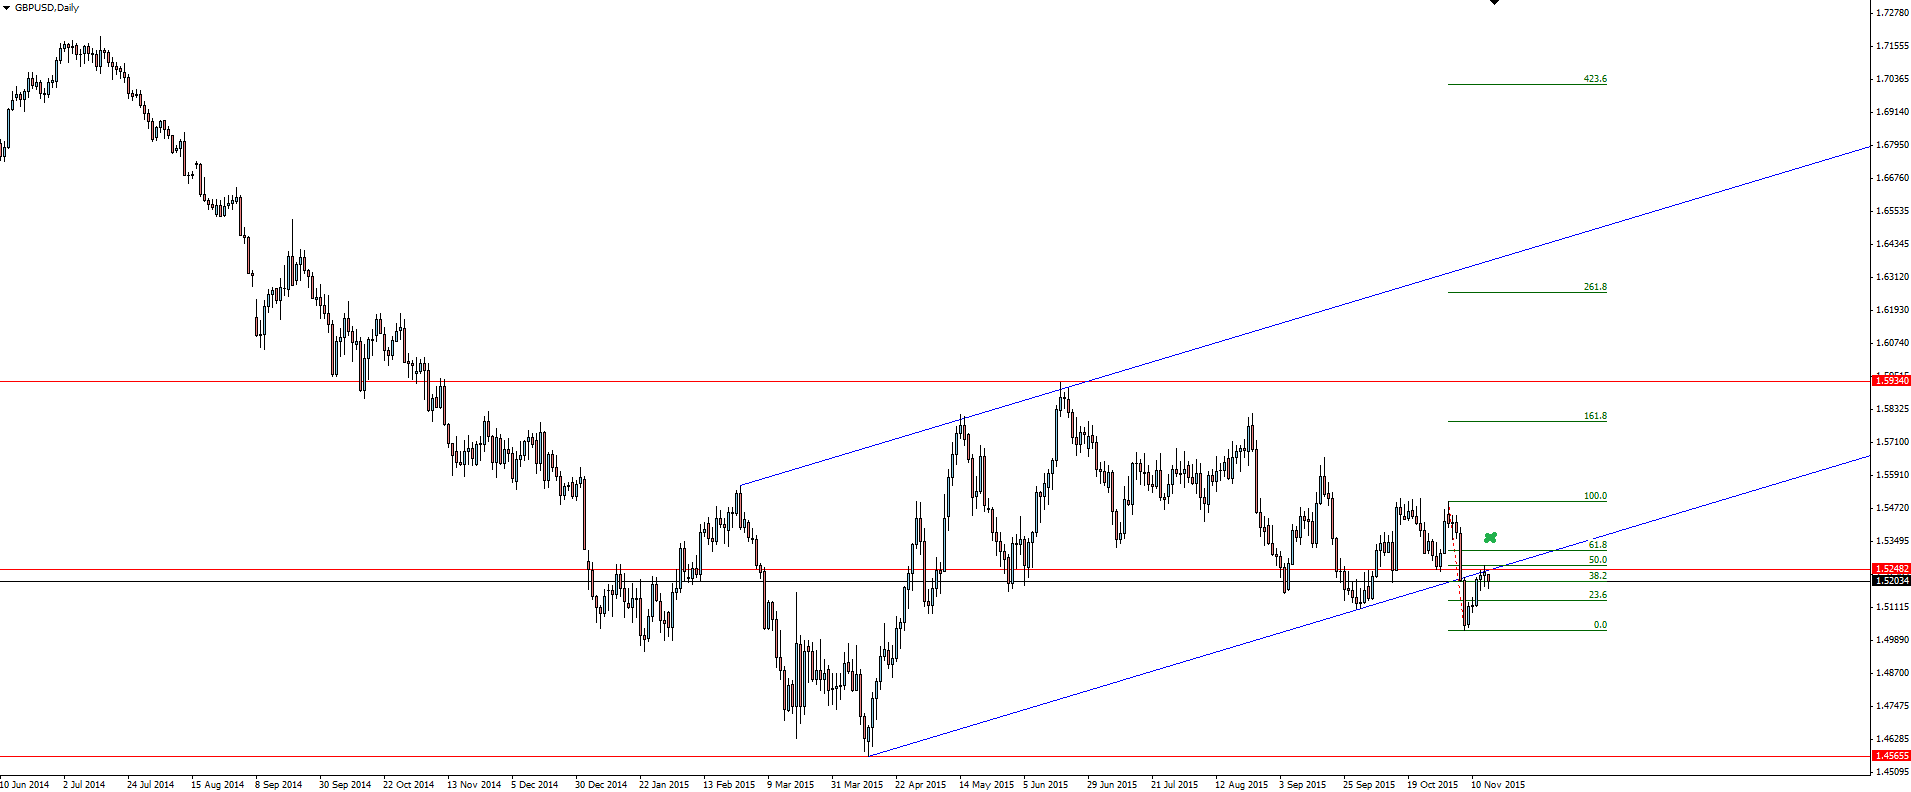
Today’s chart of the day takes a look at cable with a possible bearish trend continuation play.
GBP/USD Daily:
Click on chart to see a larger view.
With the pair still in a major bearish trend, price has now come back to re-test the previously broken, short term trend line. The way price has started to arc in an upside down ‘U’ shape as it tries to push off resistance and carry on down in the direction of the overall trend is what has pricked my interest with this setup.
Looking for confluence, I then drew fibs onto the chart from the two most recent short term price swings and low and behold, price was rejected off the 50% level almost to the pip!
Do you see opportunity trading GBP/USD?
Risk Disclosure: In addition to the website disclaimer below, the material on this page prepared by Australian Forex broker Vantage FX Pty Ltd does not contain a record of our prices, or an offer of, or solicitation for, a transaction in any financial instrument. The research contained in this report should not be construed as a solicitation to trade. All opinions, news, research, analysis, prices or other information is provided as general market commentary and marketing communication – not as investment advice. Consequently any person opening a trading account and acting on it does so entirely at their own risk. The experts writers express their personal opinions and will not assume any responsibility whatsoever for the actions of the reader. We always aim for maximum accuracy and timeliness and ECN Forex broker Vantage FX shall not be liable for any loss or damage, consequential or otherwise, which may arise from the use or reliance on this service and its content, inaccurate information or typos. No representation is being made that any results discussed within the report will be achieved, and past performance is not indicative of future performance.
