Looking for leverage long (bullish) or inverse short (bearish) exposure to daily returns on indices, equities, bonds, commodities or currencies?
For experienced traders, leveraged and inverse exchange-traded funds (ETFs) can be appropriate vehicles to make daily trades.
In previous posts we've explored leveraged and inverse ETFs in depth, emphasizing several important characteristics that are not typically found in traditional ETFs.
Today, we continue our discussion of leveraged and inverse funds and introduce another ETF that may be appropriate for experienced traders.
Daily Returns And Leveraging
These leveraged, inverse and inverse-leveraged ETFs may offer 2× or 3× (long exposure) or −1×, −2×, or −3× (short exposure) of the underlying index's daily returns. Options are also available on many leveraged ETFs.
The daily re-leveraging of these funds creates significant risk/return consequences for portfolios, especially if they are held longer than a single day. The daily re-balancing always follows the direction of the underlying index's daily performance. However, the hedging flows from long and short leveraged ETFs on the same index do not simply "offset" each other.
For example, let us assume a 2X (double-leveraged) ETF, where the initial net asset value (NAV) is $100.
The benchmark index also starts at 100. Then on day one, the index falls 10% (i.e., to 90). On day two, the index now increases by 10%, or goes up by 10% of 90. In other words, at the end of day two, the index stands at 99.
Intuitively, over this two-day period, the reader may expect the leveraged ETF to fall by twice as much as the index, or -2%. However, the fund declines by -4%.
When the leveraged fund doubles the index's 10% decline on day one, the fund's NAV falls to $80. The next day, it goes up by 20%, twice the gain of the index, to $96.
This daily re-leveraging via the use of derivative products will, in most cases, lead to value destruction for buy-and-hold investors. It is, therefore, crucial that non-professionals appreciate their characteristics before buying these ETFs.
For instance, as we write, the S&P 500 index is up by 10.58% year-to-date (YTD). On the other hand, the Direxion Daily S&P 500 Bear 1X Shares (NYSE:SPDN) is down by 20.47%.
How about 2X leveraged and -2X inverse-leveraged funds? The Direxion Daily S&P 500 Bull 2X Shares (NYSE:SPUU) is up by 9.69% YTD. The ProShares UltraShort S&P500 (NYSE:SDS) is down by 44.37%.
Finally, the YTD numbers for 3X leveraged and -3X inverse-leveraged funds may help us see the picture better. The Direxion Daily S&P500 Bull 3X Shares (NYSE:SPXL) is down by 5.55% (that is not a misprint as it is a negative return YTD). The Direxion Daily S&P500 Bear 3X Shares (NYSE:SPXS) is down by 65.06%. Similarly, the ProShares UltraPro Short S&P500 (NYSE:SPXU) is also down by 65.18%. It is clear from these numbers that these funds are not meant to be held over the long term.
With that said, here is our leveraged ETF for today.
Direxion Daily Semiconductor Bull 3X Shares
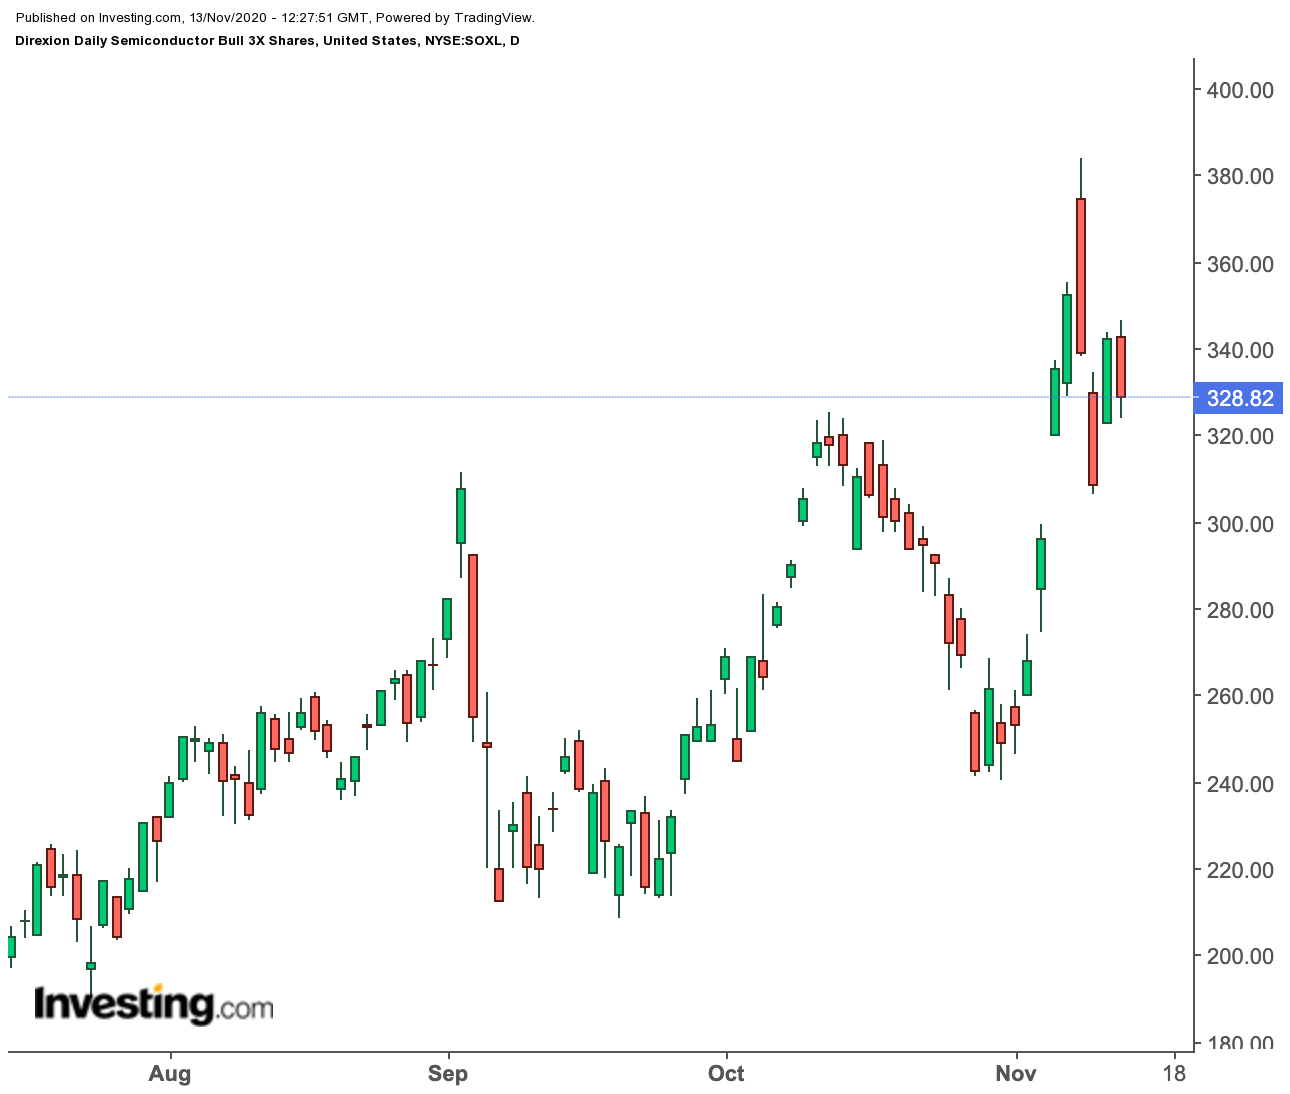
- Current price: $328.82
- 52-week range: $53.50 - $383.98
- Expense ratio: 0.93%
The Direxion Daily Semiconductor Bull 3X Shares (NYSE:SOXL) aims to achieve daily investment results of 300% of the performance of the Philadelphia Semiconductor Index, which is up by 35.77% YTD. By comparison, SOXL is up by only 24.47%. Thus over the course of ten and a half months, targeted returns look different due to the compounding effects of the daily re-balancing.

A long-term investor whose objective is exposure to the benchmark Philadelphia Semiconductor Index would be better off by investing in a traditional ETF, such as the iShares PHLX Semiconductor ETF (NASDAQ:SOXX) which is up by 35.79%. We have covered SOXX previously.
SOXL, on the other hand, is more appropriate for short-term traders who want to magnify returns on the benchmark index by 3x on a particular day. However, if those traders are on the wrong side of the bet, they would note that the value of SOXL declines quickly when the benchmark declines in value.
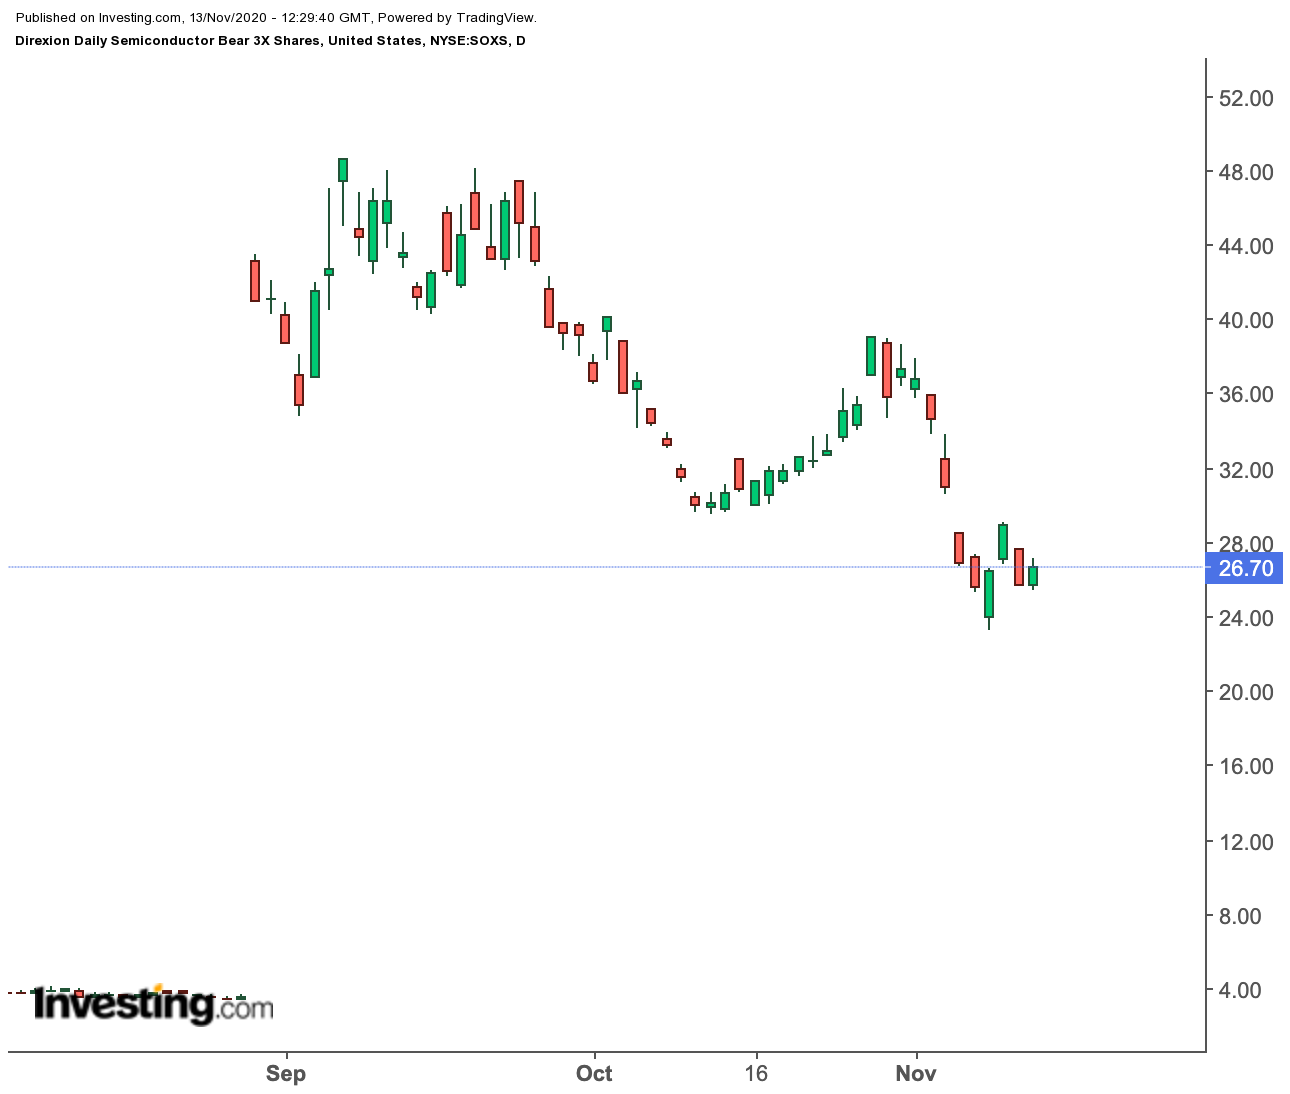
On a final note, those traders who are short-term bearish on semiconductors could use the Direxion Daily Semiconductor Bear 3X Shares (NYSE:SOXS) for daily directional bets. Since the start of the year, SOXS is down by 89.82%.

