Portfolio overwriting is a covered call writing-like strategy where we sell call options against long-term buy-and-hold securities. Generally, these are low-cost basis stocks that are dividend-bearing and trading in non-sheltered accounts. We want to leverage these stocks and exchange-traded funds (ETFs) to generate additional income but also want to avoid assignment of the shares to avoid tax issues. In essence, we want our cake and eat it too!
Setting up and managing our covered call positions are handled in a specific manner when incorporating portfolio overwriting into our investment arsenal. This article will focus in on the time frame just prior to contract expiration where share value has appreciated above the original out-of-the-money and now in-the-money strike. We will use UnitedHealth Group Incorporated (NYSE:UNH) as the June 2017 contracts were expiring on June 16, 2017.
Price chart of UNH on June 16, 2017
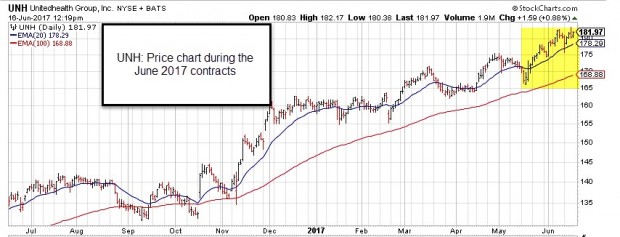
The yellow field shows a price range of $169.00 – $182.00 during the contract month.
Trade assumptions
- The June 16, 2017 $180.00 out-of-the-money calls were sold after expiration of the May 2017 contracts
- Stock price is $182.10 in the early afternoon of June 16, 2017, expiration Friday
- Contract exercise and share assignment must be avoided to avoid tax consequences
- The options must be rolled to the next month
Position management decision
Since we use out-of-the-money strikes with portfolio overwriting to allow for continued share appreciation, we must determine which strike to select.
Cost-to-close the near-month short call
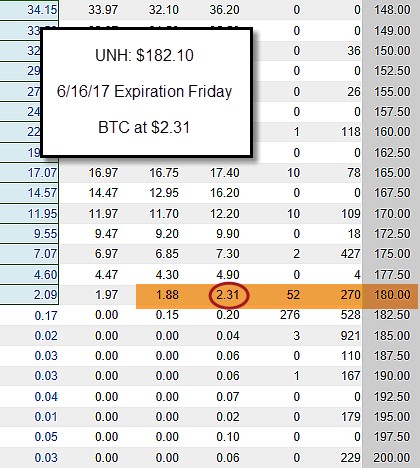
The published “ask” price is $231.00 per contract to close the near-month covered call.
Option chain for the July 21, 2017 call expirations
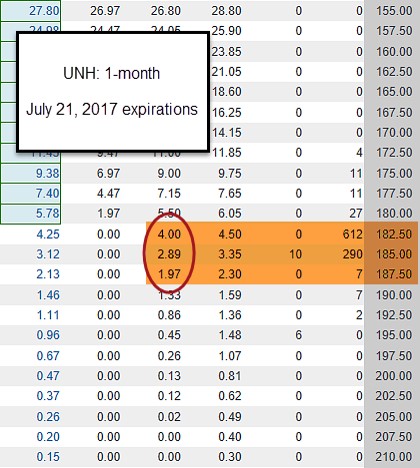
We will calculate the returns for 3 out-of-the-money strikes:
- $182.50
- $185.00
- $187.50
The Ellman Calculator
We will use the “What Now” tab of the Ellman Calculator to generate the following results:
$182.50 strike
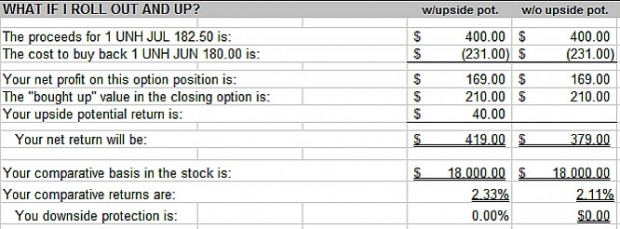
Rolling Out-And-Up to the $182.50 Strike-
$185.00 strike
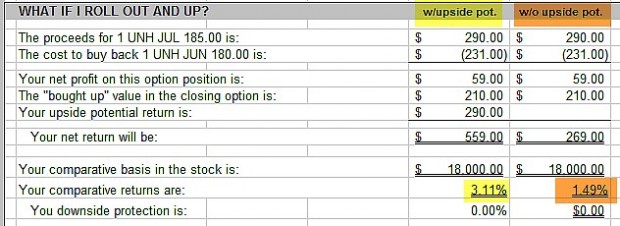
Rolling Out-And-Up to the $185.00 Strike
$187.50 strike
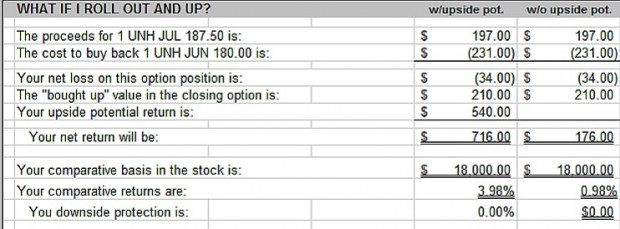
Rolling Out-And-Up to the $187.50 Strike
These three screenshots show that the $187.50 strike offers the highest total potential return (option premium + share appreciation to the new strike = 3.98%). The $182.50 strike generates the highest initial return (2.11%) for option premium only.
Discussion
When using portfolio overwriting, it is understood that in-the-money strikes must be rolled prior to contract expiration to avoid tax issues and continue dividend flow. When significant share appreciation has taken place, we look to roll out-and-up. The selection of the new out-of-the-money strike will be dictated by our evaluation of the degree of bullishness we assess the market. If strongly bullish, we would favor deeper out-of-the-money strikes to capture more share appreciation in addition to the option premium. We select slightly out-of-the-money strikes when there is a bearish tone to our market outlook.
***Thanks to Paul S. for inspiring this article.
Market tone
Global stocks dipped a bit lower this week, with Japan’s Nikkei average a bright spot, closing at a 21-year high. The price of a barrel of West Texas Intermediate crude oil rose about $1 to $52.60 while stock market volatility, as measured by the Chicago Board Options Exchange Volatility Index (VIX), was relatively unchanged at 9.80 from 9.9 last week. This week’s economic and international news of importance:
- The European Central Bank delivered a “dovish taper” The ECB will buy $30 billion worth of European bonds each month starting in January and ending in September
- The US economy grew at a faster-than-forecast pace of 3% in the third quarter, beating 2.5% forecasts
- Real consumer spending showed continued strength last quarter, rising 2.4%, which exceeded forecasts of 2.2%
- Core inflation remained well below the US Federal Reserve’s 2% target, coming in steady at 1.3%
- The Ifo Business Climate Index hit a record high this week, reflecting confidence that Europe’s economic recovery will extend into the future
- China’s Communist Party, Xi Jinping was elected to a second term as president
- The House of Representatives passed the Senate’s budget bill, laying the procedural groundwork for the passage of a tax reform package without any support from the Democratic opposition
- The US dollar advanced strongly late in the week, particularly against the euro, lifted in part by the ECB’s relatively dovish shift toward a less accommodative monetary policy
- The leadership of five large British business groups wrote to Prime Minister Theresa May this week that their members will start moving jobs and investment outside the United Kingdom if a transition deal with the European Union is not agreed soon
- Japanese prime minister Shinzo Abe won a landslide victory in last weekend’s general election, opening the way for a push to amend the country’s pacifist constitution
- With 45% of the constituents of the S&P 500 Index having reported Q3 earnings, the blended estimate for aggregate year-over-year earnings growth is 5.3%
- Excluding the energy sector, the earnings growth estimate is 3.0%. The blended aggregate revenue growth projection for the quarter is 4.8%. However, stripping out energy, revenue is expected to rise 3.9%
THE WEEK AHEAD
Mon Oct 30th
- Eurozone: Economic sentiment index
- US: Personal income/spending
Tue Oct 31st
- China: Purchasing manager’s indicies
- Japan: Bank of Japan rate decision
- Eurozone: Consumer prices
Wed Nov 1st
- Japan, UK, US: Manufacturing PMIs
- US: FOMC rate-setting meeting
Thu Nov 2nd
- Eurozone: Manufacturing PMIs
- UK: Bank of England rate-setting meeting
Fri Nov 4th
- US: Employment report
- China, UK, US: Services PMI
- Canada: Employment, trade reports
For the week, the S&P 500 rose by 0.23% for a year-to-date return of 15.29%
Summary
IBD: Market in confirmed uptrend
GMI: 6/6- Buy signal since market close of August 31, 2017
BCI: My portfolio makeup reflects a slightly bullish bias, selling 3 out-of-the-money calls for every 2 in-the-money calls.
WHAT THE BROAD MARKET INDICATORS (S&P 500 AND VIX) ARE TELLING US
The 6-month charts point to a slightly bullish outlook. In the past six months, the S&P 500 was up 8% while the VIX (9.80) moved down by 5%.
Much success to all,
