The markets on crack have largely ignored the coronavirus, which obviously could be a potential game changer. And now they react, down 2,600 points on the Dow, as soon as it hits a “white toast” country like Italy. Yes, the markets are quite bigoted!
The markets have been on a tear ever since the Fed started pumping money feverously due to the repo crisis, and have continued with the coronavirus. That has stalled for now, hence I expected a correction here…
But it’s gone about as far as it should if it is to not break that strong final thrust that started in early October, looking very similar to the one from October 1999 into March 2000, in the last great tech bubble peak.

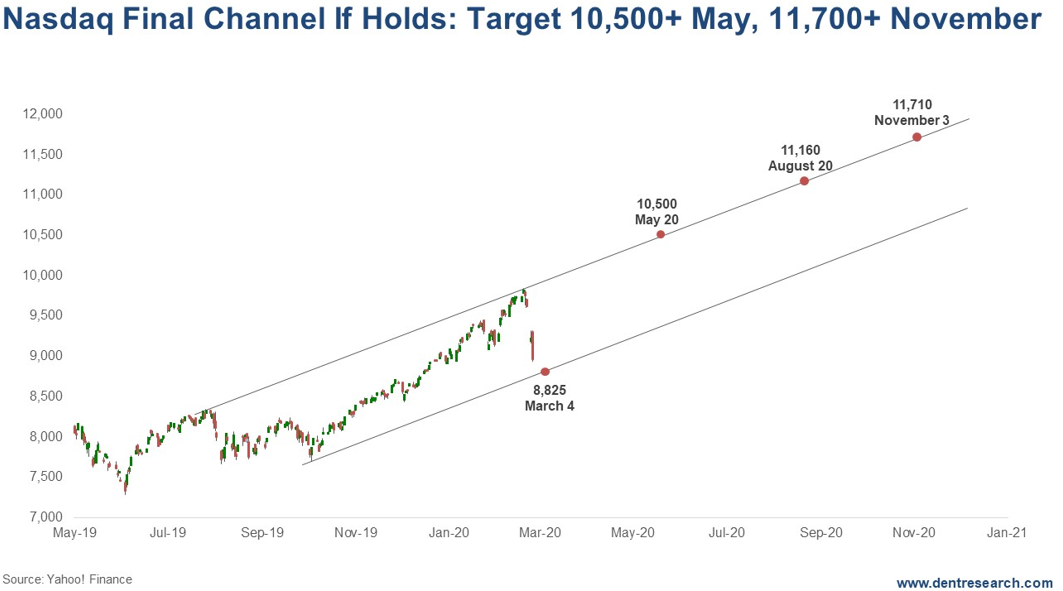
The NASDAQ chart shows a still clear channel if we don’t see the market break down much more than another 1%.
My two best short-term cycle guys are looking for a correction bottom between late February and early March. I’ve noted the bottom of the channel trendline as of March 4, the day after Super Tuesday, where Sanders’ strong lead may become more confirmed. A shot at a balls-out socialist winning is “game over” for this bubble.
The Nasdaq needs to hold around 8,800 near-term and 8,825 by March 4 to hold this channel convincingly. If so, it should continue up and see 20%+ gains by late May, the first likely turning point, and 33%+ by the election if it lasts that long.
This recent advance looks like the third wave up, and what’s going on now looks like the fourth wave correction. If the fifth wave is the same length, that would take us into late July or so with a target of 10,900+.

Note that the final wave tends to have a “throw-over” rally above the channel before it collapses. That means we could see the Nasdaq as high as 12,000+, a 35% gain from here.
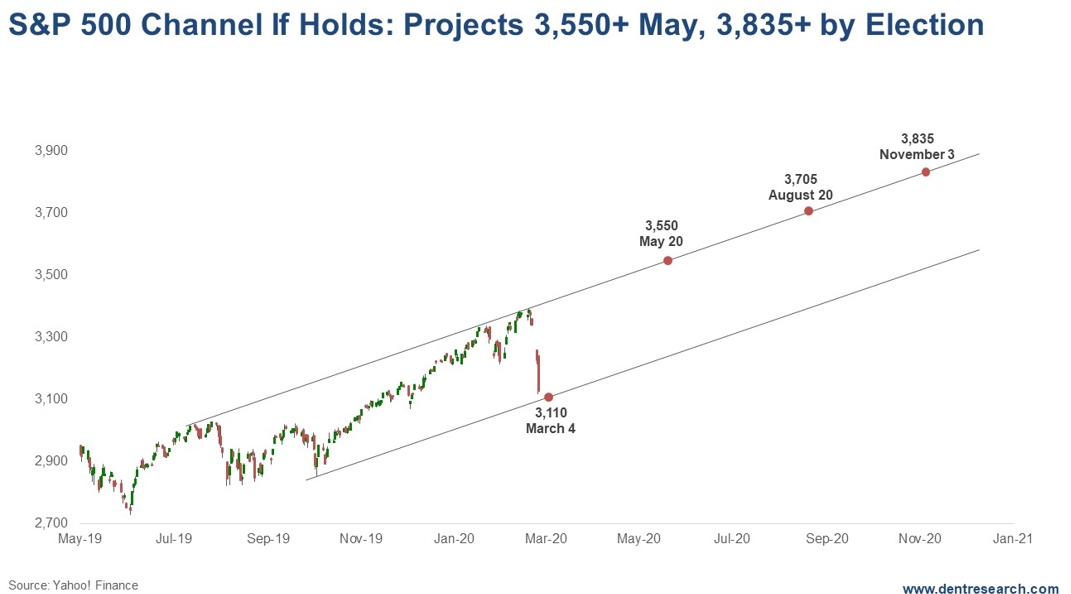
The S&P 500 is similar with even a tighter tolerance down to 3,080 on the downside near-term. The targets by May would project 15%+ returns and by the election 24%+. Hitting 4,000 would be a good top-end overthrow target, a 30% gain from here.
The tech stocks – and more so, the FAANGs – should continue to lead if this final orgasmic phase continues. If, instead, the markets break down too much further, another 8% to 10% downside is likely and a top in place becomes more of a possibility.
