Below looks at the Nikkei index from Japan and China's Shanghai Composite. It's important to note that both markets are now in rising trends.
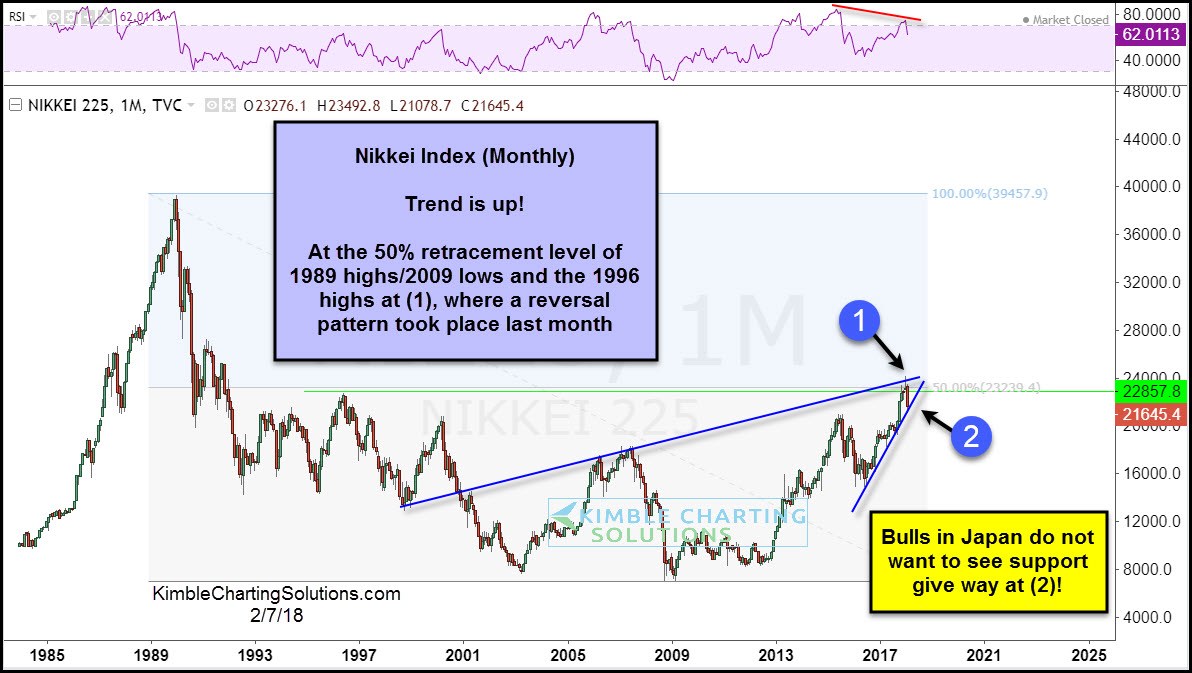
Below we see the Nikkei on a monthly basis over the past 30 years.
As noted above, the Nikkei's trend is up at this time. The rally over the past few years has the Nikkei testing the 50% retracement level of its giant bear market that peaked in 1998 and bottomed in 2009. It is also testing the highs of 1996 at (1), as momentum is lofty and creating lower highs.
Bulls in Japan want/need to see rising support hold at (2). If it doesn’t, selling pressure could take place.
Next we have the Shanghai index.

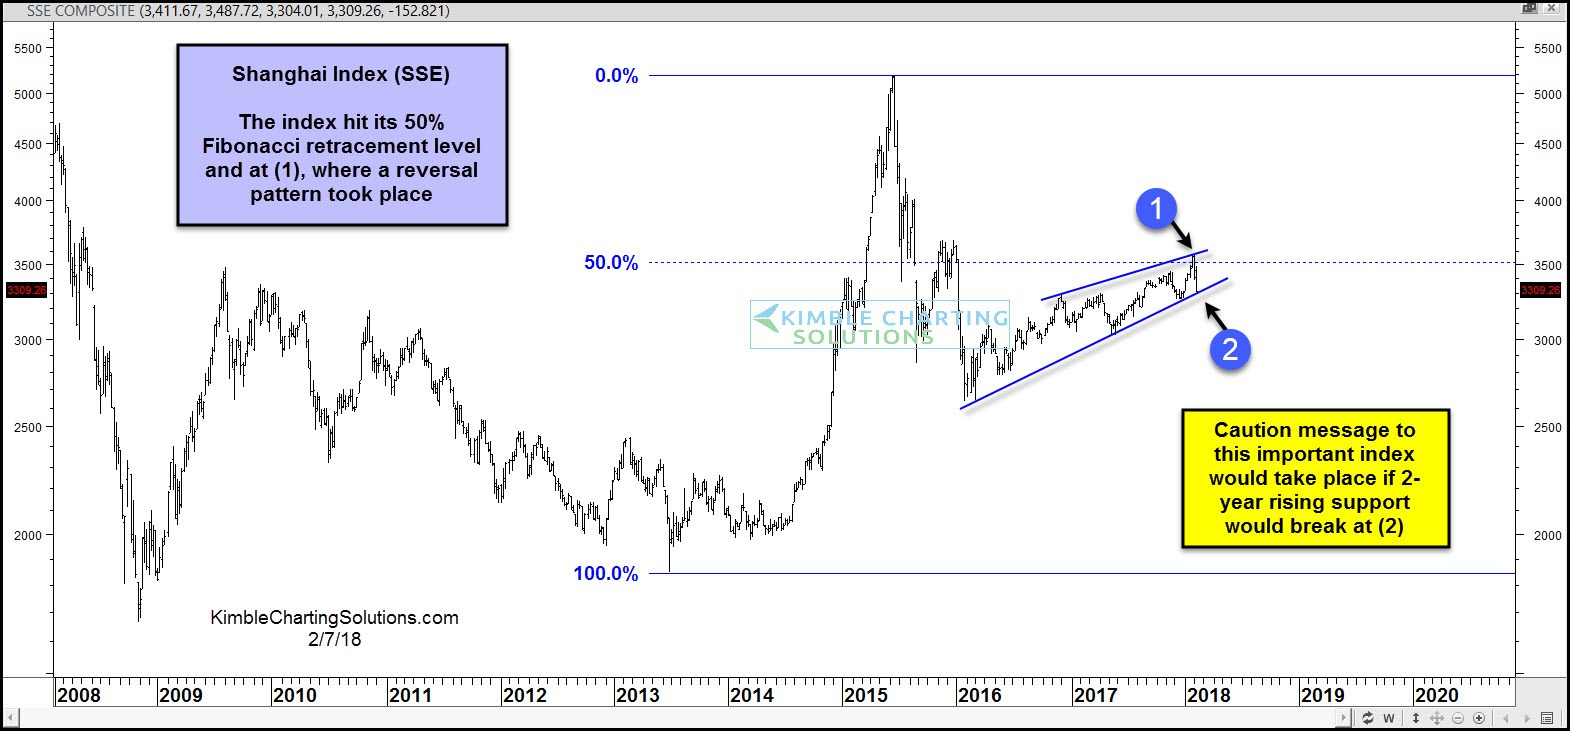
Like the Nikkei, the Shanghai's trend is also up and the rally of the past several years has it testing the 50% Fibonacci retracement level at (1), where a reversal pattern recently took place. Rising support is in play at (2) and bulls in China want/need support to hold at (2).
Bottom Line
Both of these key indices are in rising trends and each recently hit a 50% Fibonacci retracement level where some selling pressure took place. Both are now testing important rising support lines that bulls in each country want/need to hold.
The bulls want to see breakouts above the 50% retracement levels on each index.

