🥇 First rule of investing? Know when to save! Up to 55% off InvestingPro before BLACK FRIDAYCLAIM SALE

Does S&P Have Further To Go?

Published 09/23/2020, 07:08 AM
Updated 09/20/2023, 06:34 AM
NDX
-
SPY
-
AMZN
-
TSLA
-
KS11
-
PYPL
-

Today is a rather important day for the market because it will tell us if we have further to recover or if we are about to take another sharp leg lower.

S&P 500

The SPY is trading a touch higher in the pre-market, about 34 bps, and complete whatever is left of the gap filll from Monday’s drop. Typically once a gap gets filled, it results in the continuation of the previous trend, which has been lower. However, a breach of $332.90 likely results in a further push higher to $342.25, and retest of that break down from last week.
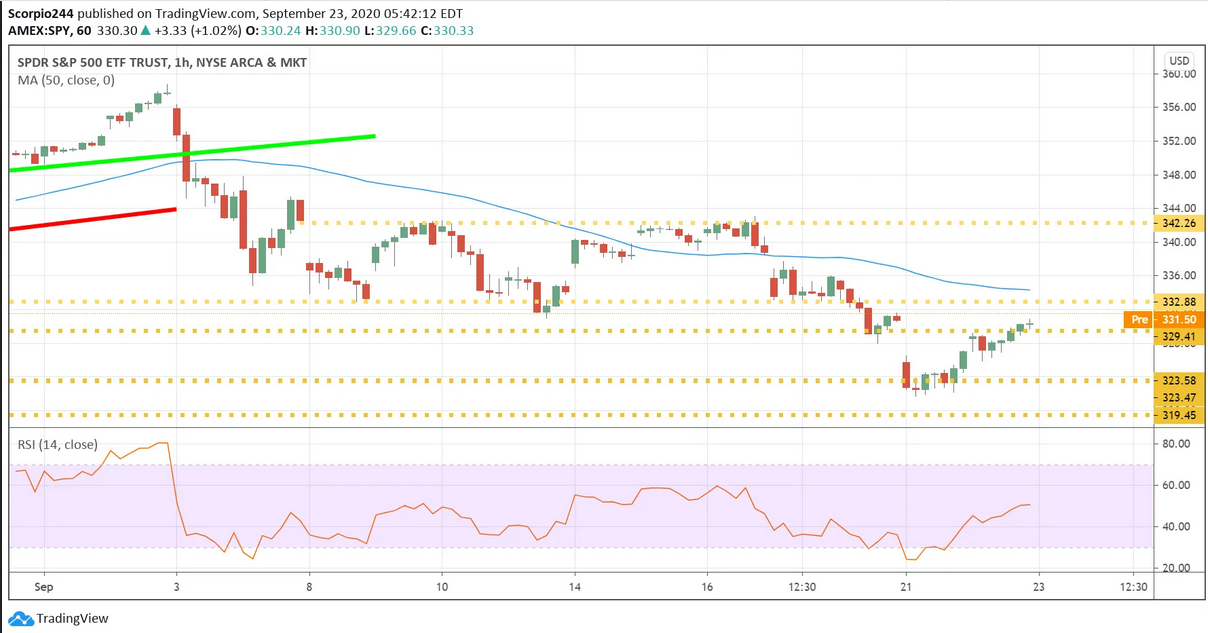
S&P 500 ETF 1 Hr Chart

South Korea

It was a wild night in South Korea, with the index rising by 90 basis points to start the night, then fell sharply, by nearly 3%, until to finish the day flat. Please don’t ask me what went over there, but that is massive volatility.
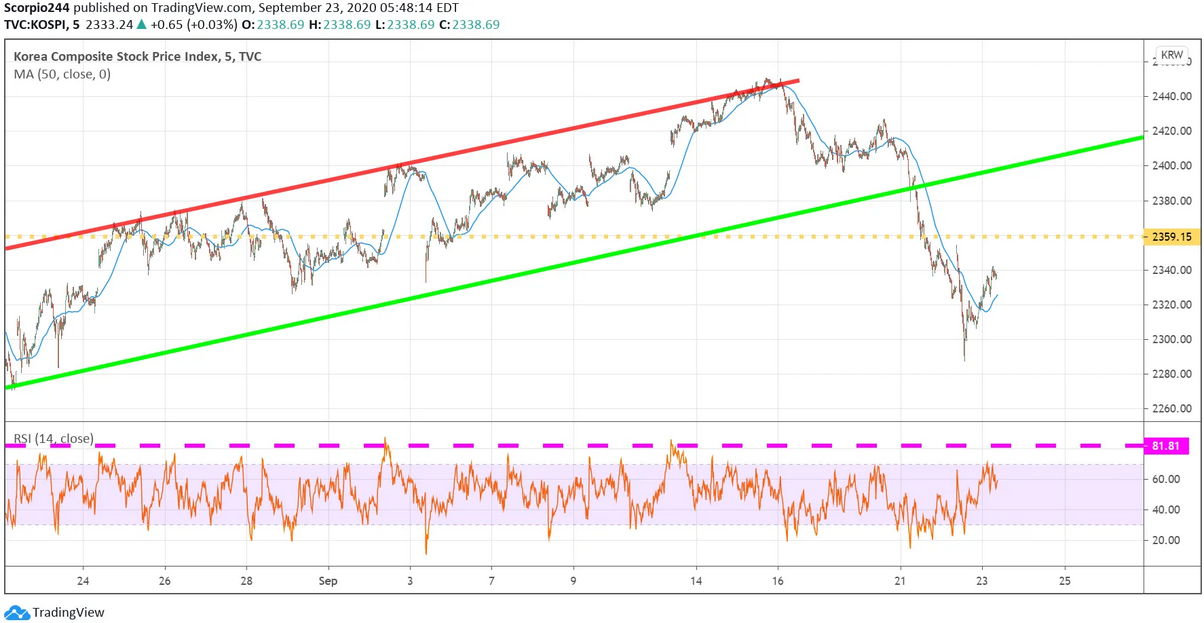
KOSPI Index Chart

Tesla

Tesla (NASDAQ:TSLA) is falling this morning after Battery Day. I watched some of it, not all of it. The company essentially reiterated guidance for the year around 500,000, give or take. The stock is trading lower, and I’m not sure if it is because the low-end of the range for guidance is shy of the 500,000 or because much of what I saw was focused on things that aren’t likely to result in anything soon. Either way, the stock has struggled at $440 and should find some support at around $390.
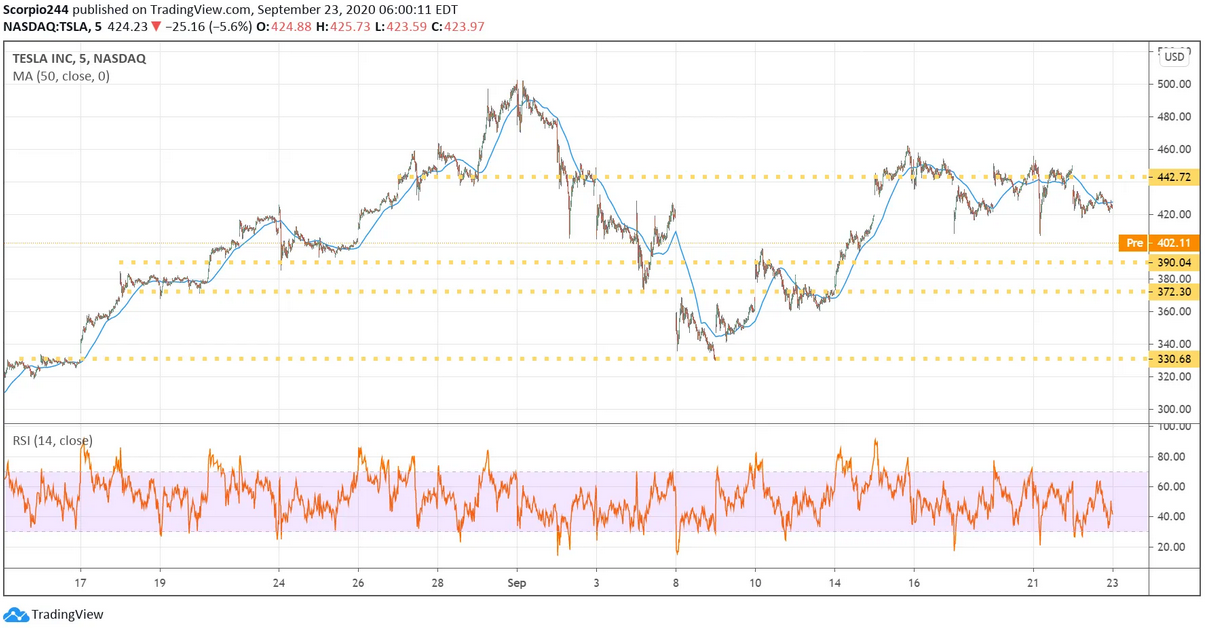
Tesla Inc Chart

PayPal

PayPal (NASDAQ:PYPL) broke a short-term downtrend and has some room to rise to around $198.
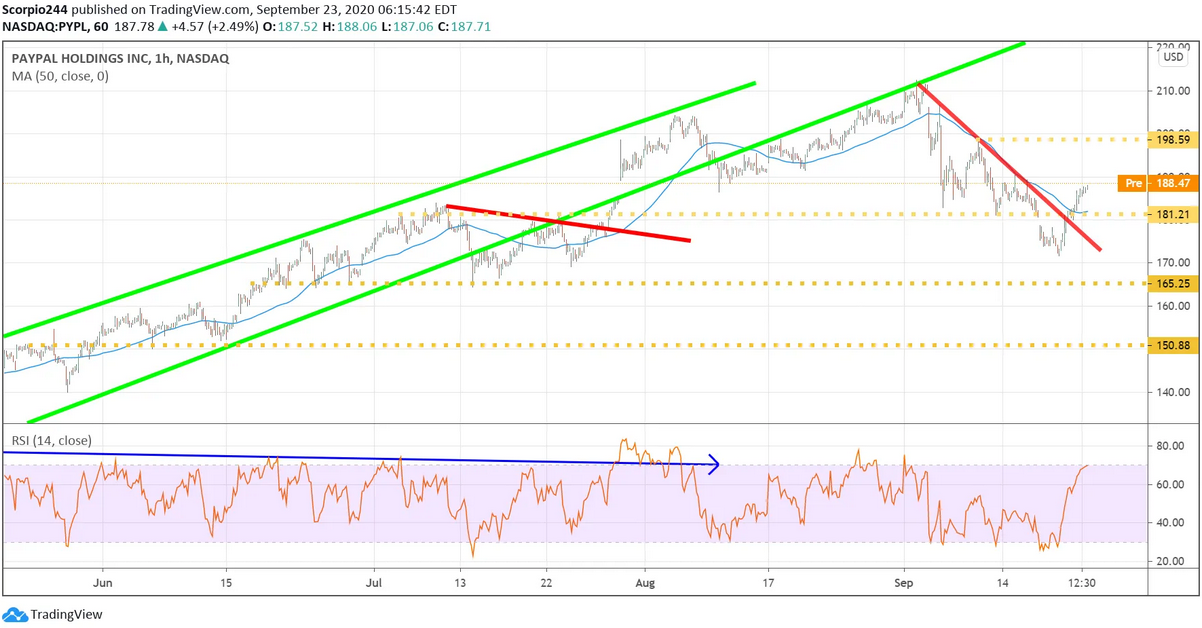
PayPal 1 Hr Chart

Amazon

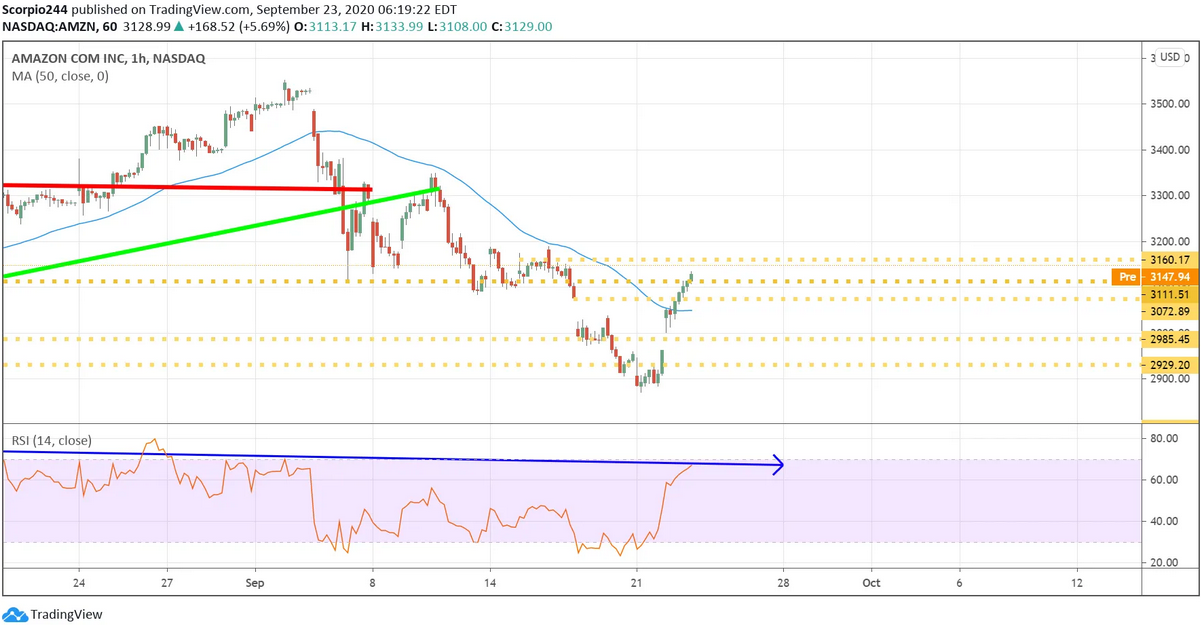
Amazon (NASDAQ:AMZN) has been pushing higher in the pre-market, and there appears to be some more room to rise, perhaps to around $3,160, before resuming lower.
Amazon Inc Hourly Chart

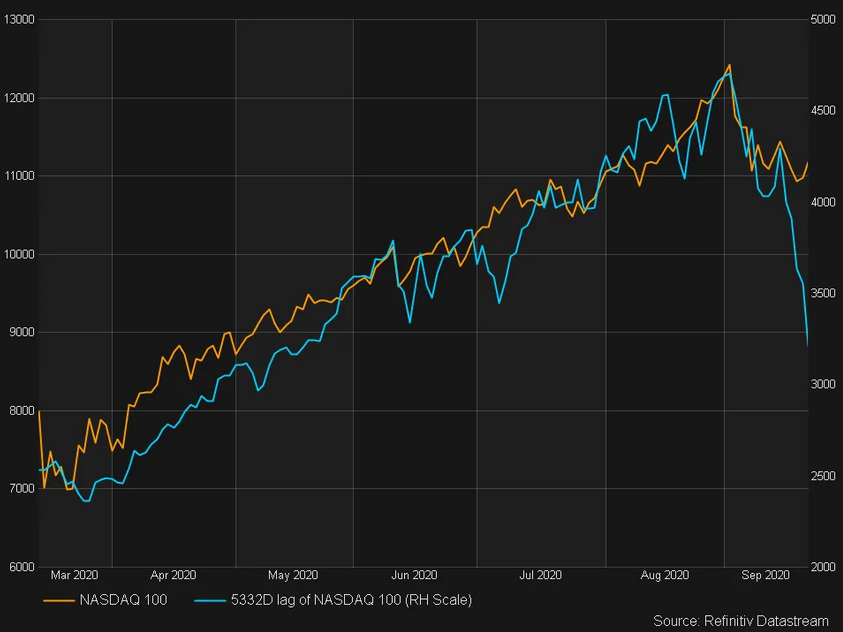
Anyway, I will leave with this last thing to think about. I found this to be stunning and shocking. I hope this turns out to be wrong, by the way. It is a chart of today’s NASDAQ 100 overlayed with the NASDAQ 100 in late 1999.
Nasdaq 100 Graph

But here is the amazing are part:

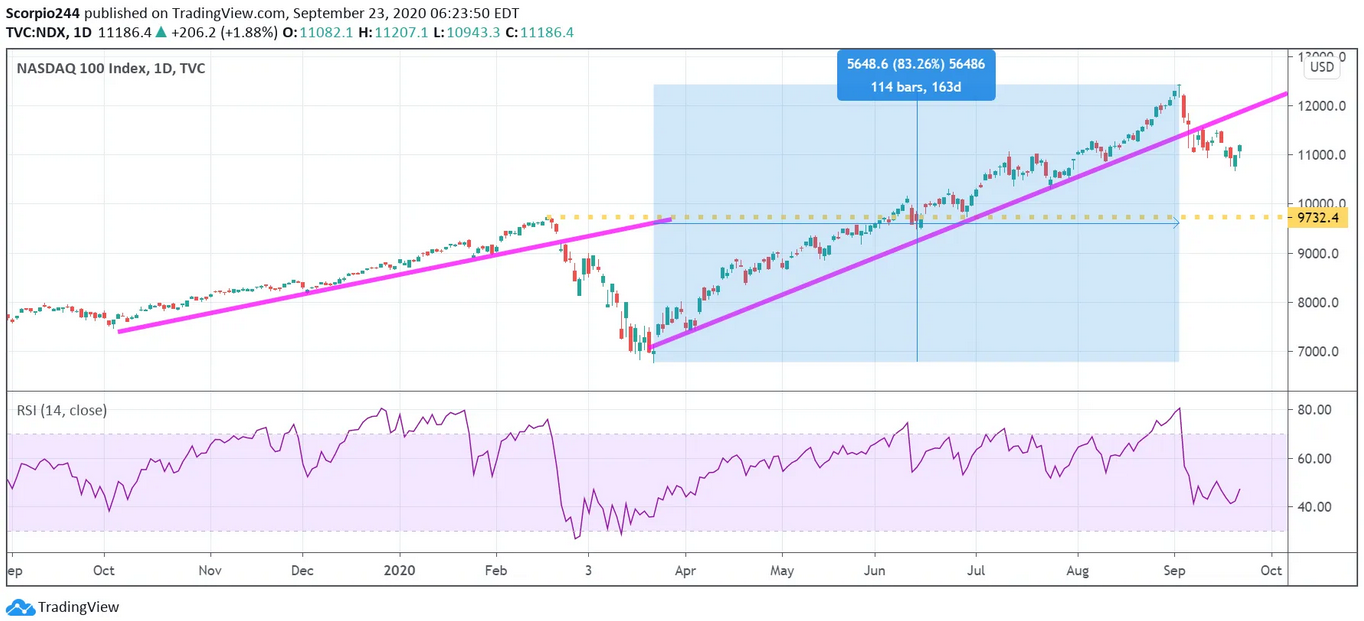
From the March 2020 lows, the NASDAQ rose about 84% over 163 days.
Nasdaq 100 Daily Chart

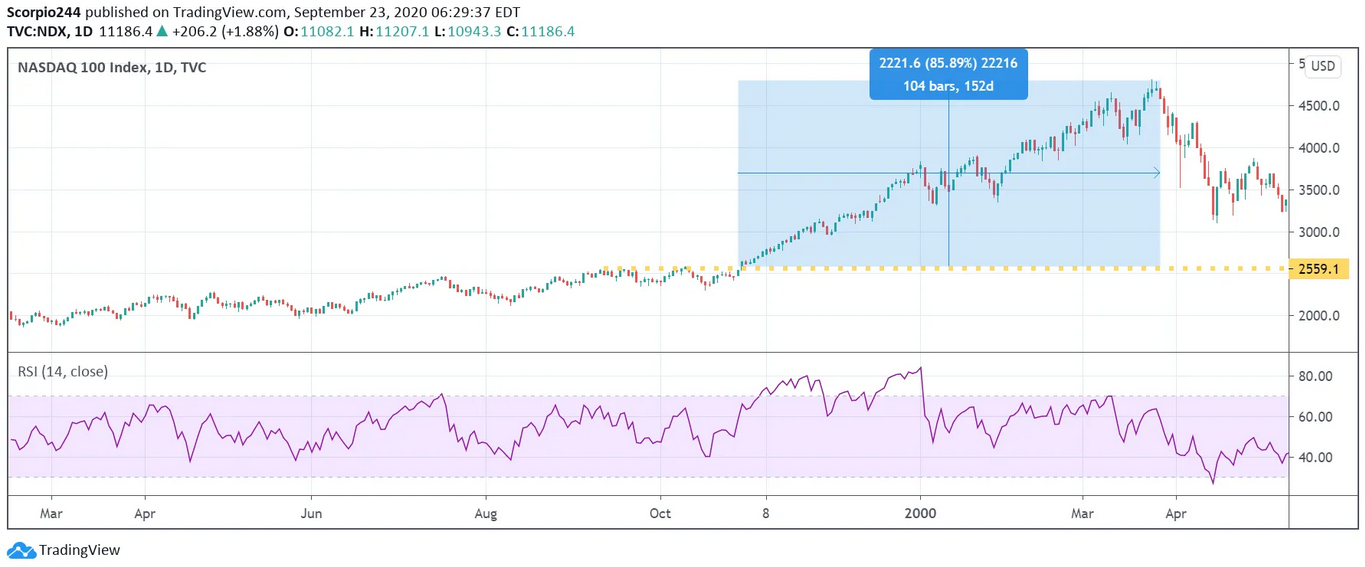
Meanwhile, from the November 1999 break out to the peak, the NASDAQ 100 rose about 86% over 151 days. I don’t know, maybe it is just chance, but still awfully strange.
Nasdaq 100 Index Daily Chart

I guess we are going to find out soon whether the similarities end there.

Original Post

Latest comments

Loading next article…
Risk Disclosure: Trading in financial instruments and/or cryptocurrencies involves high risks including the risk of losing some, or all, of your investment amount, and may not be suitable for all investors. Prices of cryptocurrencies are extremely volatile and may be affected by external factors such as financial, regulatory or political events. Trading on margin increases the financial risks.
Before deciding to trade in financial instrument or cryptocurrencies you should be fully informed of the risks and costs associated with trading the financial markets, carefully consider your investment objectives, level of experience, and risk appetite, and seek professional advice where needed.
Fusion Media would like to remind you that the data contained in this website is not necessarily real-time nor accurate. The data and prices on the website are not necessarily provided by any market or exchange, but may be provided by market makers, and so prices may not be accurate and may differ from the actual price at any given market, meaning prices are indicative and not appropriate for trading purposes. Fusion Media and any provider of the data contained in this website will not accept liability for any loss or damage as a result of your trading, or your reliance on the information contained within this website.
It is prohibited to use, store, reproduce, display, modify, transmit or distribute the data contained in this website without the explicit prior written permission of Fusion Media and/or the data provider. All intellectual property rights are reserved by the providers and/or the exchange providing the data contained in this website.
Fusion Media may be compensated by the advertisers that appear on the website, based on your interaction with the advertisements or advertisers.
© 2007-2024 - Fusion Media Limited. All Rights Reserved.