Just recently, Wealth Management had an interesting interview with Jeremy Grantham in which Jeremy suggests the “rules have changed” for value investors. To wit:
The market was extremely well-behaved from 1935 until 2000. It was an orderly world in which to be a value manager: there was mean reversion. If a value manager was patient, he was in heaven. The market outperformed when it was it cheap, and when it got expensive, it cracked.
Since 2000, it’s become much more complicated. The rules have shifted. We used to say that this time is never different. I think what has happened from 2000 until today is a challenge to that. Since 1998, price-earnings ratios have averaged 60 percent higher than the prior 50 years, and profit margins have averaged 20 to 30 percent higher. That’s a powerful double whammy.
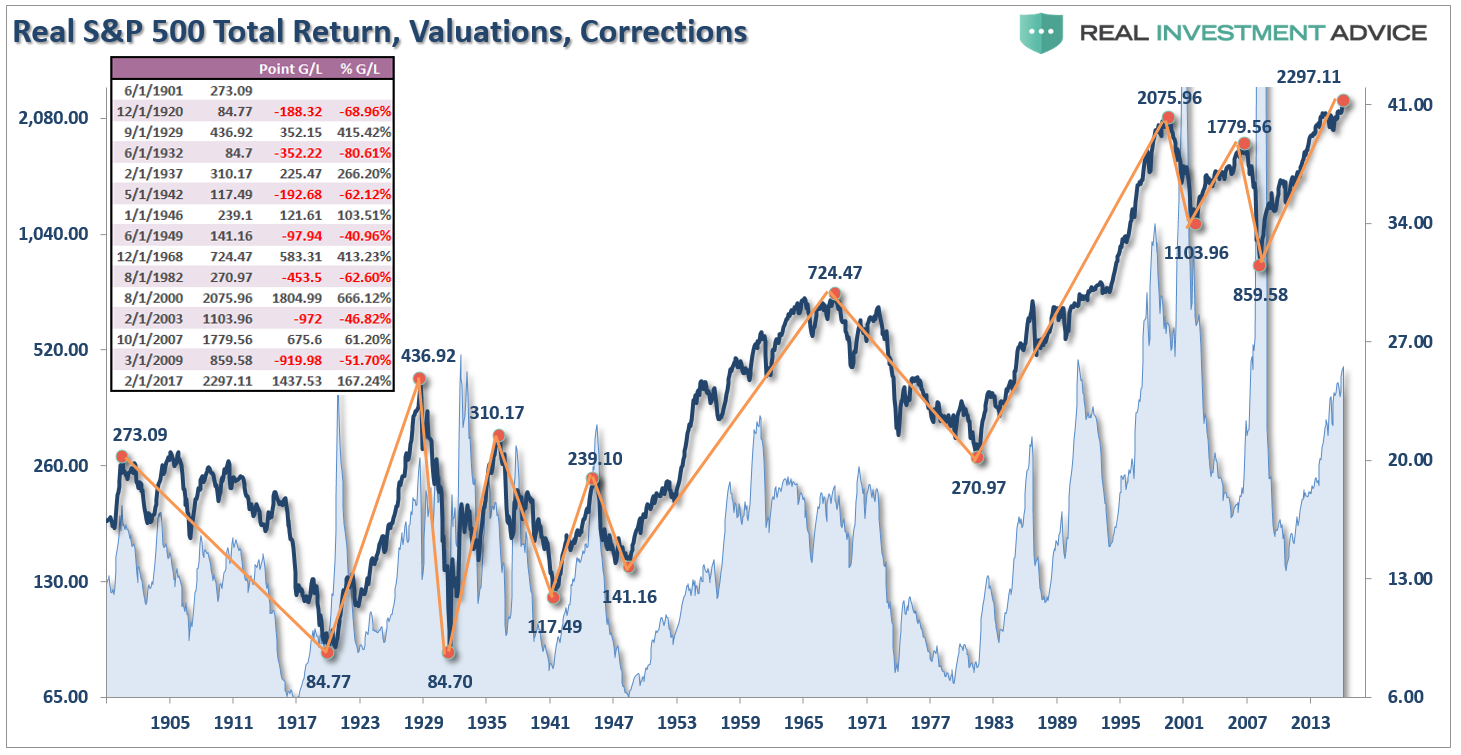
He is correct. As shown below, the average CAPE ratio leve rose, beginning in 1980 to 21.67 from the average of 14.42 over the previous 80-years.
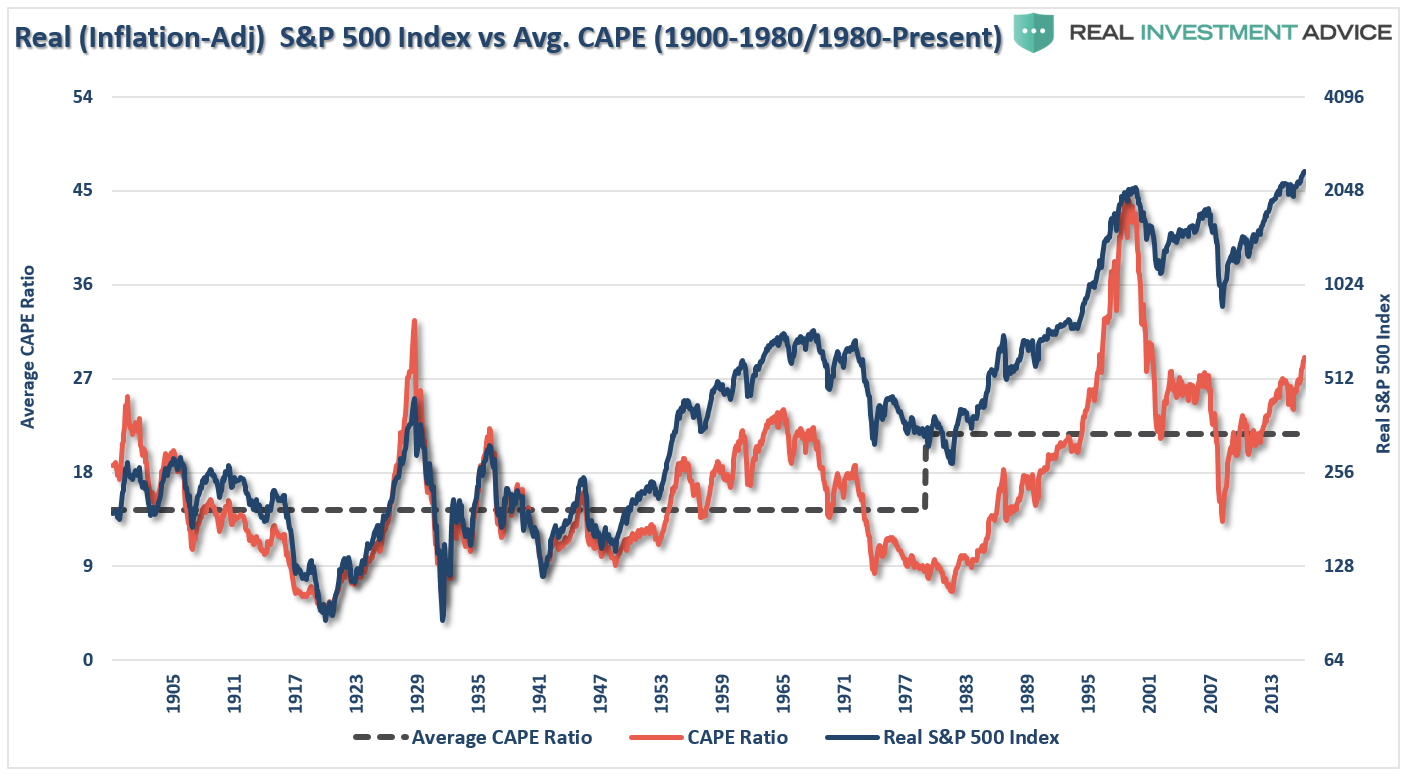
Of course, the bulk of that increase is due to the valuation anomaly of the 1999 Dot-com bubble, which skewed earnings to astronomical extremes. If we normalize that period, average valuation levels have only slightly increased in recent years. However, there is no argument that fundamental valuation measures have indeed changed, and arguably for the worse.
There is some truth to the argument that “this time is different.” The accounting mechanizations that have been implemented over the last five years, particularly due to the repeal of FASB Rule 157 which eliminated “mark-to-market” accounting, have allowed an ever increasing number of firms to “game” earnings season for their own benefit. Such gimmickry has suppressed valuation measures far below levels they would be otherwise.
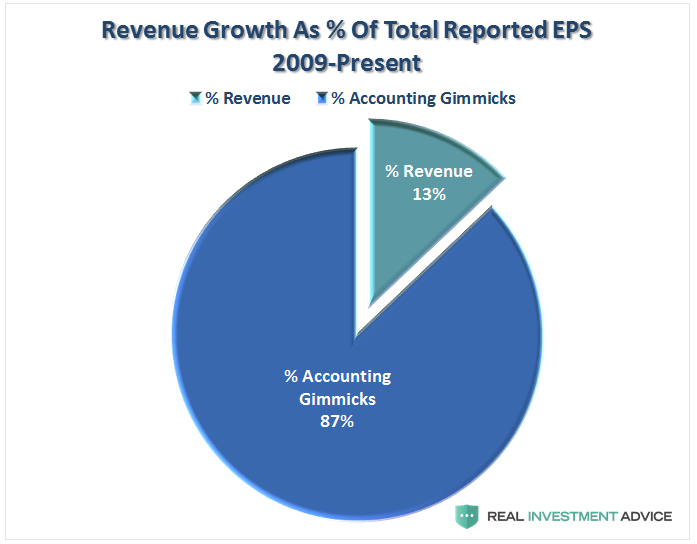
While operating earnings are the primary focus of analysts, the media and hucksters, there are many problems with the way in which these earnings are derived due to one-time charges, inclusion/exclusion of material events, and outright manipulation to “beat earnings.” This problem has been exacerbated since the end of the financial crisis, as we will discuss more in a moment, to the point to where only 13% of total revenue growth is coming from actual revenue, the rest is from accounting gimmickry, buybacks, and outright fudging.
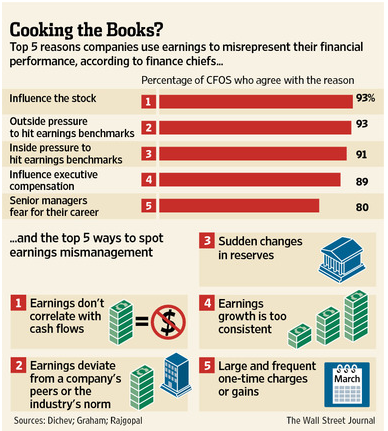
The Wall Street Journal confirmed as much in a 2012 article entitled “Earnings Wizardry” which stated:
“f you believe a recent academic study, one out of five [20%] U.S. finance chiefs have been scrambling to fiddle with their companies’ earnings. Not Enron-style, fraudulent fiddles, mind you. More like clever—and legal—exploitations of accounting standards that ‘manage earnings to misrepresent [the company’s] economic performance,’ according to the study’s authors, Ilia Dichev and Shiva Rajgopal of Emory University and John Graham of Duke University. Lightly searing the books rather than cooking them, if you like.
This should not come as a major surprise as it is a rather “open secret.” Companies manipulate bottom line earnings by utilizing “cookie-jar” reserves, heavy use of accruals, and other accounting instruments to either flatter, or depress, earnings.
The tricks are well-known: A difficult quarter can be made easier by releasing reserves set aside for a rainy day or recognizing revenues before sales are made, while a good quarter is often the time to hide a big ‘restructuring charge’ that would otherwise stand out like a sore thumb. What is more surprising though is CFOs’ belief that these practices leave a significant mark on companies’ reported profits and losses. When asked about the magnitude of the earnings misrepresentation, the study’s respondents said it was around 10% of earnings per share.
Of course, the reason that companies do this is simple: stock-based compensation. Today, more than ever, many corporate executives have a large percentage of their compensation tied to company stock performance. A “miss” of Wall Street expectations can lead to a large penalty in the companies stock price. Therefore, it is not surprising to see 93% of the respondents pointing to “influence on stock price” and “outside pressure” as reasons for manipulating earnings.
Note: For fundamental investors, this manipulation of earnings skews valuation analysis particularly with respect to P/E’s, EV/EBITDA, PEG, etc.
This was brought to the fore again recently by the Associated Press in: “Experts Worry That Phony Numbers Are Misleading Investors:”
Those record profits that companies are reporting may not be all they’re cracked up to be.
As the stock market climbs ever higher, professional investors are warning that companies are presenting misleading versions of their results that ignore a wide variety of normal costs of running a business to make it seem like they’re doing better than they really are.
What’s worse, the financial analysts who are supposed to fight corporate spin are often playing along. Instead of challenging the companies, they’re largely passing along the rosy numbers in reports recommending stocks to investors.
Here are the key findings of the report:
- Seventy-two percent of the companies reviewed by AP had adjusted profits that were higher than net income in the first quarter of this year. That’s about the same as in the comparable period five years earlier, but the gap between the adjusted and net income figures has widened considerably: adjusted earnings were typically 16 percent higher than net income in the most recent period versus 9 percent five years ago.
- For a smaller group of the companies reviewed, 21 percent of the total, adjusted profits soared 50 percent or more over net income. This was true of just 13 percent of the group in the same period five years ago.
- Quarter after quarter, the differences between the adjusted and bottom-line figures are adding up. From 2010 through 2014, adjusted profits for the S&P 500 came in $583 billion higher than net income. It’s as if each company in the S&P 500 got a check in the mail for an extra eight months of earnings.
- Fifteen companies with adjusted profits actually had bottom-line losses over the five years. Investors have poured money into their stocks just the same.
- Stocks are getting more expensive, meaning there could be a greater risk of stocks falling if the earnings figures being used to justify buying them are questionable. One measure of how richly priced stocks are suggesting trouble. Three years ago, investors paid $13.50 for every dollar of adjusted profits for companies in the S&P 500 index, according to S&P Capital IQ. Now, they’re paying nearly $18.
Less than one-year later, individuals are paying nearly $25 for 12-month reported EPS at roughly the same level as they were at the end of 2013.
The obvious problem when it comes to investing and the markets is that playing “leapfrog with a unicorn” has very negative outcomes. While valuations may not matter currently, in hindsight it will become clear that such valuation levels were clearly unsustainable. However, the financial media will report such revelations long after it is of use to anyone.
This Time Is Not Different
The eventual outcome will be the same as every previous speculative/liquidity driven bubble throughout history. The only difference will be the catalyst that eventually sends investors running for cover.
Just as it was in 1999 where “investing like Warren Buffett was like driving Dad’s old Pontiac,” it is near the end of an elongated “bull market cycle,” where price discovery becomes impaired, that investors become lulled into a sense of false security. At the heart of these cycles is always a central thesis. In 1999 it was “dot.com” stocks, in 2007 it was “real estate” and as noted recently, it is now “passive indexing.”
Our evidence suggests the growth of ETFs may have (unintended) long-run consequences for the pricing efficiency of the underlying securities.’
The detrimental effects to the market snowball from there. Fewer trades occur, so liquidity in single stocks deteriorates, raising transaction costs. That only further discourages professional traders, so the price discrepancies remain without the informational arbitrage to close the gaps.
The problem with the lack of liquidity, as I discussed last week, is what happens when prices revert at a time when leverage is at historical highs. Throughout history, when prices have deviated more than 10% above their 3-year moving average, corrections and reversions have often followed.
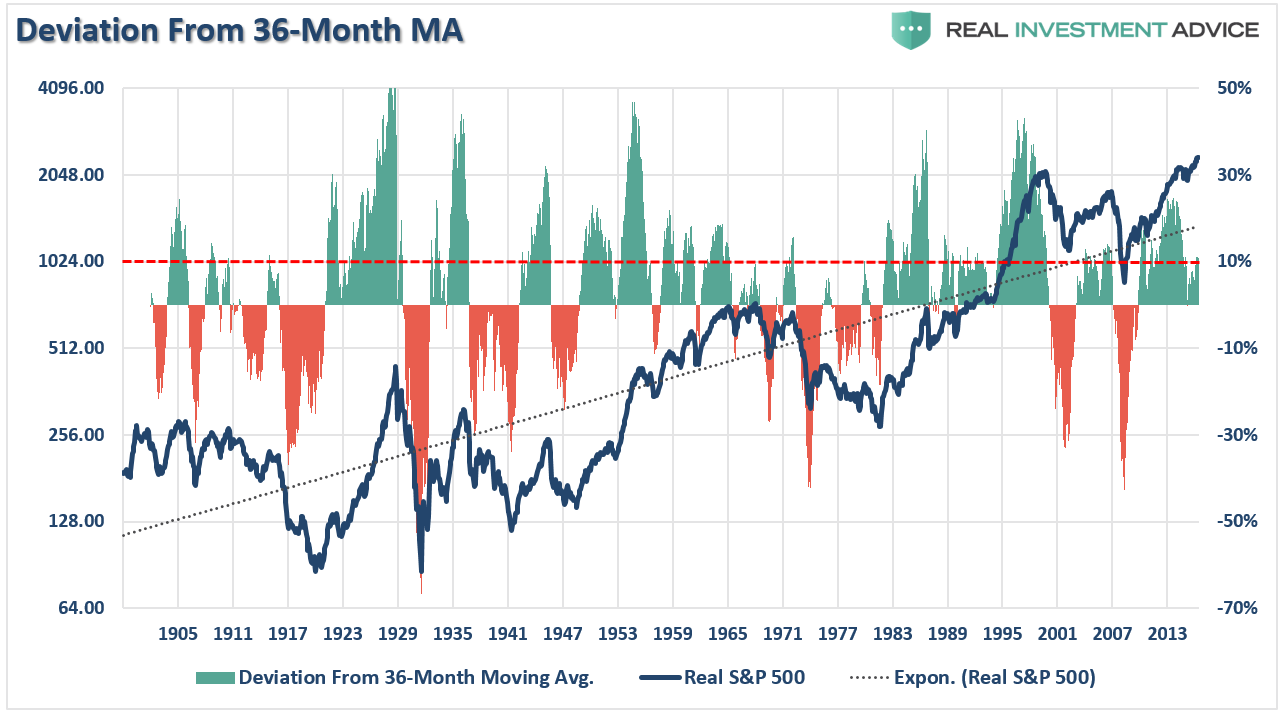
Importantly, the magnitude of those corrections/reversions has often been dictated by the catalyst (the cause of the reversion), the amount of leverage in the system, and the economic damage caused by it.
For example, in 2008, the markets running at roughly 12% above the long-term mean, well below the 40% deviation is 2000, yet the catalyst (Lehman) and the subsequent economic fallout caused by the financial crisis, ripped through the financial markets to the same degree as the Dot-com crash.
Furthermore, the biggest market crashes have come from when valuation levels were trading above 23x earnings.
As David Einhorn recently wrote to his investors:
The bulls explain that traditional valuation metrics no longer apply to certain stocks. The longs are confident that everyone else who holds these stocks understands the dynamic and won’t sell either. With holders reluctant to sell, the stocks can only go up – seemingly to infinity and beyond. We have seen this before.
There was no catalyst that we know of that burst the dot-com bubble in March 2000, and we don’t have a particular catalyst in mind here. That said, the top will be the top, and it’s hard to predict when it will happen.
For longer term investors who are depending on their “hard earned” savings to generate a “living income” through retirement, understanding the “real” value will mean a great deal. As Michael Lebowitz noted yesterday:
There is no doubt that the market can grind higher to more dizzying valuations. However, there is also strong historical evidence this market will normalize to average valuations. In the wisdom of Bernard Baruch, there are times when you ‘make your money’ by not losing it. Perhaps more importantly, you preserve the ability to buy when better opportunities present themselves.
Is this time different?
James Montier summed this question up perfectly in “Six Impossible Things Before Breakfast,”
Current arguments as to why this time is different are cloaked in the economics of secular stagnation and standard finance workhorses like the equity risk premium model. Whilst these may lend a veneer of respectability to those dangerous words, taking arguments at face value without considering the evidence seems to me, at least, to be a common link with previous bubbles.
While investors insist the markets are currently NOT in a bubble, it would be wise to remember the same belief was held in 1999 and 2007. Throughout history, financial bubbles have only been recognized in hindsight when their existence becomes “apparently obvious” to everyone. Of course, by that point is was far too late to be of any use to investors and the subsequent destruction of invested capital.
This time will not be different. Only the catalyst, magnitude, and duration will be.
Investors would do well to remember the words of the then-chairman of the Securities and Exchange Commission Arthur Levitt in a 1998 speech entitled “The Numbers Game:”
While the temptations are great, and the pressures strong, illusions in numbers are only that—ephemeral, and ultimately self-destructive.

