Those who lived through the last two speculative blow-off tops know the impossibility of predicting the final top.
How can we tell if stocks are in the final blow-off stage of a bubble? There are four basic give-aways:
1. Parabolic rises in stocks and speculative debt.
2. The mainstream financial media claims the clearly visible bubbles are justified by fundamentals.
3. Conventional financial authorities insist this is not a blow-off top.
4. The expressions of regret of those who sat out the latest rally become ubiquitous.
In the past few days, I have read two laughably baseless justifications of the bubble in Chinese stocks by conventional financial analysts:
- A) China is a "black box," i.e. unfathomable, so go with what we know, which is that China is a nation of entrepreneurs: this is the green light to buy the bubble here if you want to reap easy profits.
- B) The stock market bubble in China is positive evidence of a healthy re-adjustment of China's financial system.
That neither thesis has the slightest foundation in reality doesn't matter, as the real agenda of the analysts is to justify their own attempts to join the crowd reaping vast profits in the bubble.
This denial, that a speculative blow-off is clearly occurring. is a key indicator that a blow-off top is in its final stages.
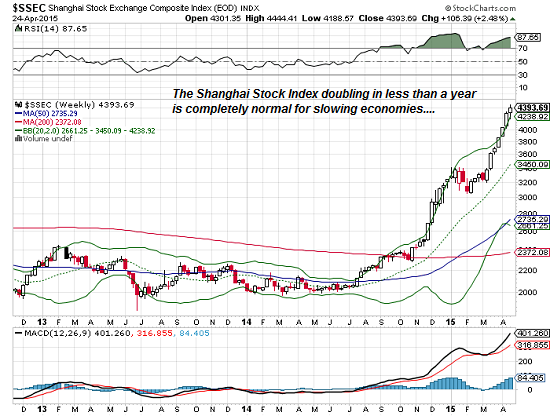
Consider the Shanghai stock index (SSEC). Is it truly normal for the stock markets of nations with economies approaching stall-speed to double in less than a year?

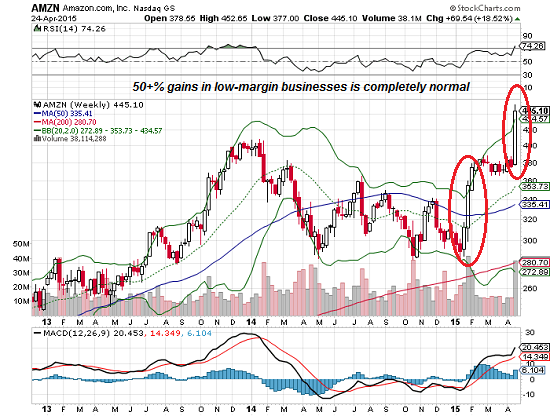
Amazon (NASDAQ:AMZN) is a large, well-run corporation, but its core businesses are low-margin (as for the cloud business--everybody and their brother is ramping up their cloud biz). Is it truly normal for a low-margin company's stock to rise 50+% in four months?

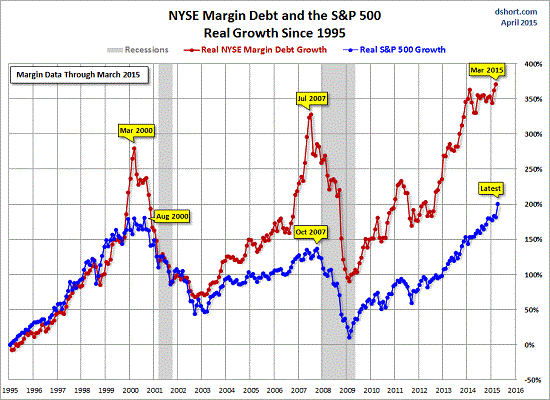
Margin debt reflects the "animal spirits" of speculation and confidence. When borrowed money is used to buy more stocks, it makes the resulting rise vulnerable to a decline that forces recent buyers to liquidate their positions to cover their margin calls.
Margin debt has reached new highs; what happened when margin debt hit these levels in prior cycles?

The soaring confidence in future advances that define blow-off tops is visible in declining measures of volatility such as the VIX and VXX. (Recall that volatility and stocks are on a see-saw; should the VXX reverse and move higher, stocks would plummet.)

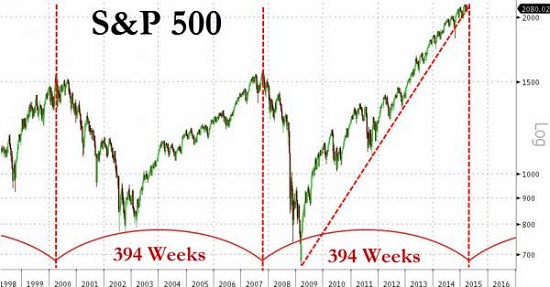
One last method to identify blow-off tops is to look for repeating patterns that marked previous blow-off tops, below, the S&P 500 since 1998.

Those who lived through the last two speculative blow-off tops know the impossibility of predicting the final top. Those who bet the top is in (i.e. make short bets that will gain if the market reverses and drops) are often forced to cover when the market advances further, and this panic buying pushes the market even higher.
Only when the ranks of bears willing to bet against the market thin will the short-covering boost dissipate. At that point of bearish exhaustion, the market will roll over when the greater fools (last buyers of the blow-off top) run out of margin buying power.
